Supply chain first look
Logistics live map
Supply-chain software tells you what has been scanned and booked. A live map shows whether the physical node still looks active. GodsView AI provides that second view for logistics: ships in a strait, flights over a hub, and fires, quakes or storms when the disruption is a hazard.
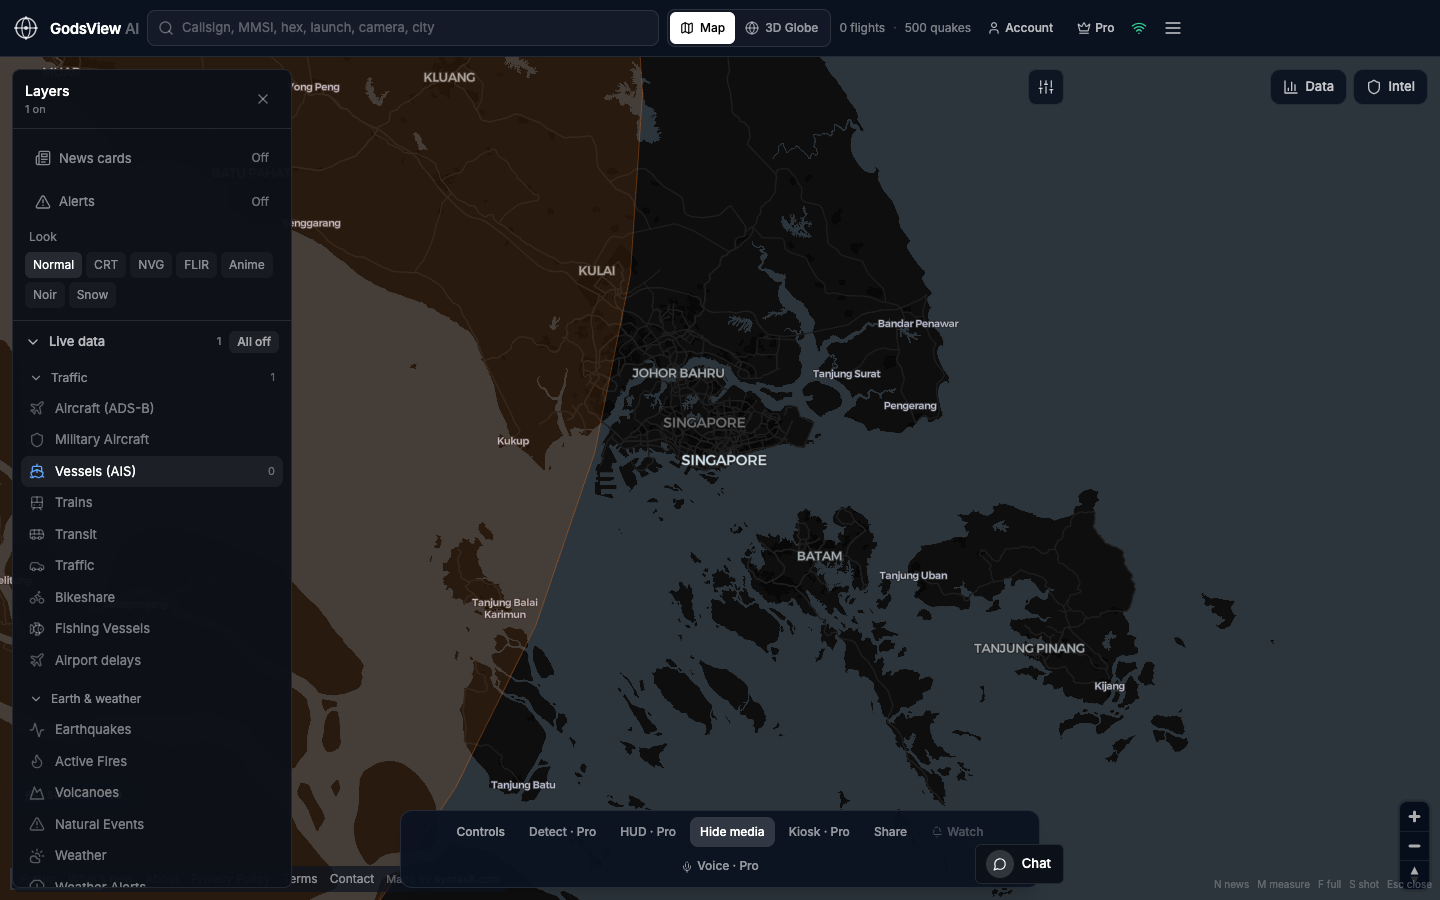
A ten-minute check
- Name the node: a port, strait, airport or rail city.
- Switch off every layer you do not need.
- Turn on Vessels for water and Aircraft for air. Add Earthquakes, Active Fires or weather alerts if the news is a hazard.
- Search an MMSI or callsign if you have one. Otherwise, read the traffic density.
- Note the time. An empty area can mean a coverage gap rather than a closure.
What the data can and cannot show
Ship positions come from a terrestrial AIS stream, so coverage is strongest near coasts and thinner far offshore. You will not get predicted arrival times or cargo details. You will get a current geographic picture you can share as a link, and Pro adds vessel arrival and departure alerts and watch-area alerts.
Questions
Can GodsView AI replace a transport management system or a maritime data platform?
No. GodsView shows whether a corridor looks busy or quiet right now. Container-level status, predicted arrival times and voyage history stay in your transport system and specialist maritime data providers.
Which layers should I use for a port or strait?
Start with Vessels for water traffic. Add Aircraft for a nearby air hub, and Earthquakes, Active Fires or weather alerts if the disruption is a hazard.
Related trackers
Optional email list: subscribe from the page in a browser, or open an account.