Guide
Shipping Chokepoints on a Live Map: What to Watch
A handful of narrow straits and canals carry a large share of world trade. Here is why each one matters, what 2026 has looked like, and how to read the traffic on a live AIS map.
Key takeaways
- EIA estimates the Strait of Malacca (23.2 million b/d) and the Strait of Hormuz (20.9 million b/d) carried the most oil of any chokepoints in the first half of 2025.
- Hormuz traffic has been heavily disrupted since regional hostilities began on 28 February 2026, and Red Sea transits in September 2026 were still well below pre-crisis levels.
- On a live map, watch transit counts in each direction, anchorage queues, speed changes and AIS gaps rather than single ships.
- AIS transit counts only include ships that are transmitting, and GNSS interference can create false tracks, so confirm with official advisories.
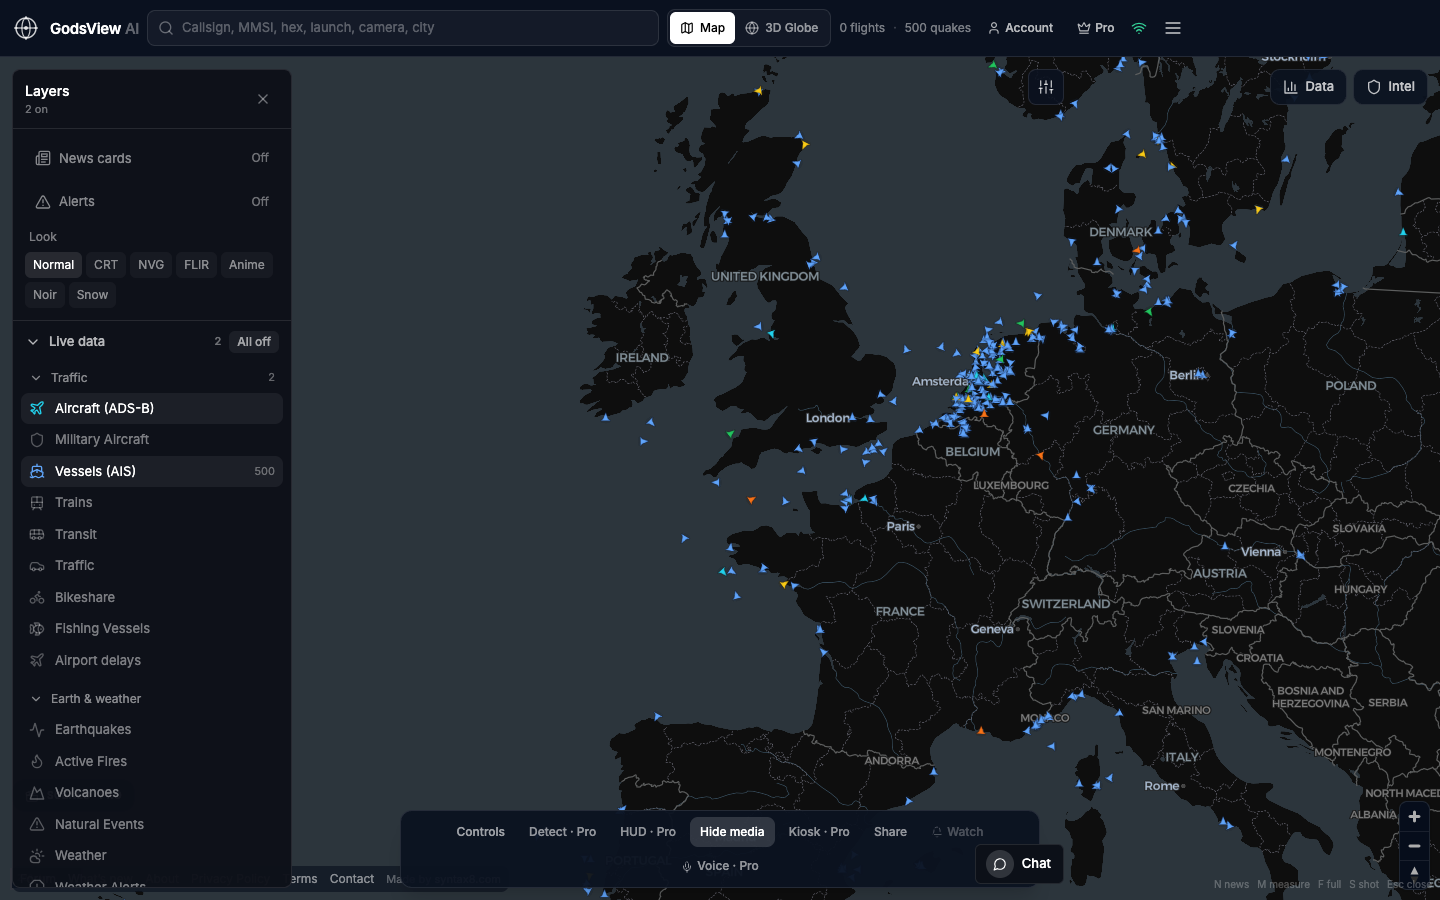
Shipping chokepoints are narrow straits and canals that large volumes of world trade must pass through, such as the Strait of Hormuz, the Bab el-Mandeb, the Suez Canal, the Strait of Malacca and the Panama Canal. On a live map you can watch them by following AIS ship traffic: how many vessels pass in each direction, how long the queues at anchor are, and whether ships are slowing, turning back or going dark.
Chokepoints matter because there are few alternatives. When one closes or becomes dangerous, ships detour by thousands of miles, freight and insurance costs rise, and cargo arrives late. 2026 has shown this sharply, with severe disruption in the Strait of Hormuz and a slow, uneven return of traffic to the Red Sea.
This guide covers each major chokepoint, the numbers that show why it matters, what has changed in 2026, and a practical checklist for reading chokepoint traffic on a live AIS map without over-reading it.
What is a shipping chokepoint?
A chokepoint is a narrow passage on a widely used sea route. The US Energy Information Administration (EIA), which tracks oil flows through them, notes that about 76% of world petroleum and other liquids supply, roughly 79.8 million barrels per day (b/d), moved by sea in the first half of 2025 (EIA). Much of that seaborne oil passes through at least one chokepoint, and container, grain and gas carriers use the same routes.
Three things make a chokepoint vulnerable: it is narrow enough to block or threaten, the detour around it is long, and the surrounding region has a history of conflict, piracy or weather problems.
The world's main chokepoints at a glance
| Chokepoint | Connects | Oil flow, million b/d (EIA) | 2026 watch points |
|---|---|---|---|
| Strait of Malacca | Indian Ocean and Pacific | 23.2 (1H25) | Congestion, piracy reports, Singapore anchorages |
| Strait of Hormuz | Persian Gulf and Gulf of Oman | 20.9 (1H25) | Attacks on shipping, GNSS interference, very low transit counts |
| Suez Canal and SUMED pipeline | Red Sea and Mediterranean | 4.9 (1H25) | Gradual return of container lines |
| Bab el-Mandeb | Red Sea and Gulf of Aden | 4.2 (1H25) | Houthi threat to shipping |
| Danish Straits | Baltic and North Sea | 4.9 (1H25) | Baltic tanker traffic |
| Turkish Straits (Bosporus) | Black Sea and Mediterranean | 3.7 (1H25) | Narrow, congested passage |
| Panama Canal | Pacific and Atlantic | 2.3 (FY2025) | Draft limits when Gatun Lake is low |
| Cape of Good Hope | Detour around Africa | 9.1 (1H25) | Rises when the Red Sea is avoided |
Source: EIA World Oil Transit Chokepoints, last updated 3 March 2026. The Strait of Gibraltar and the Taiwan Strait are not in EIA's oil table but are covered below because of their traffic.
Strait of Hormuz
The Strait of Hormuz sits between Oman and Iran and links the Persian Gulf with the Gulf of Oman. In 2024, oil flows through it averaged about 20 million b/d, equal to about 20% of global petroleum liquids consumption and more than a quarter of global seaborne oil trade, and about one-fifth of global LNG trade also passed through (EIA). EIA estimated that only about 2.6 million b/d of pipeline capacity was available to bypass the strait.
What has happened in 2026
Shipping through Hormuz has been severely disrupted since regional hostilities began on 28 February 2026. The Joint Maritime Information Center (JMIC) put the historical average at about 138 transits a day and observed only 5 vessels in the 24 hours to 7 April 2026 (JMIC advisory, 9 April 2026). Traffic later recovered partially: Lloyd's List Intelligence counted 124 non-Iranian-linked transits in the week of 21 to 27 September 2026, while also reporting at least 13 tanker attacks since 28 September and a threat level still described as severe (Lloyd's List Intelligence).
What to watch on the map
- Transits in each direction. Compare eastbound and westbound ships passing the narrows over several hours.
- Anchorage build-up off Fujairah and in the Gulf of Oman, which shows ships waiting rather than transiting.
- GNSS interference. JMIC has reported GNSS, GPS and AIS interference around the Hormuz approaches, the Gulf of Oman and the Arabian Gulf (JMIC). Ships that appear to sit on land or jump at impossible speeds are usually showing bad position data.
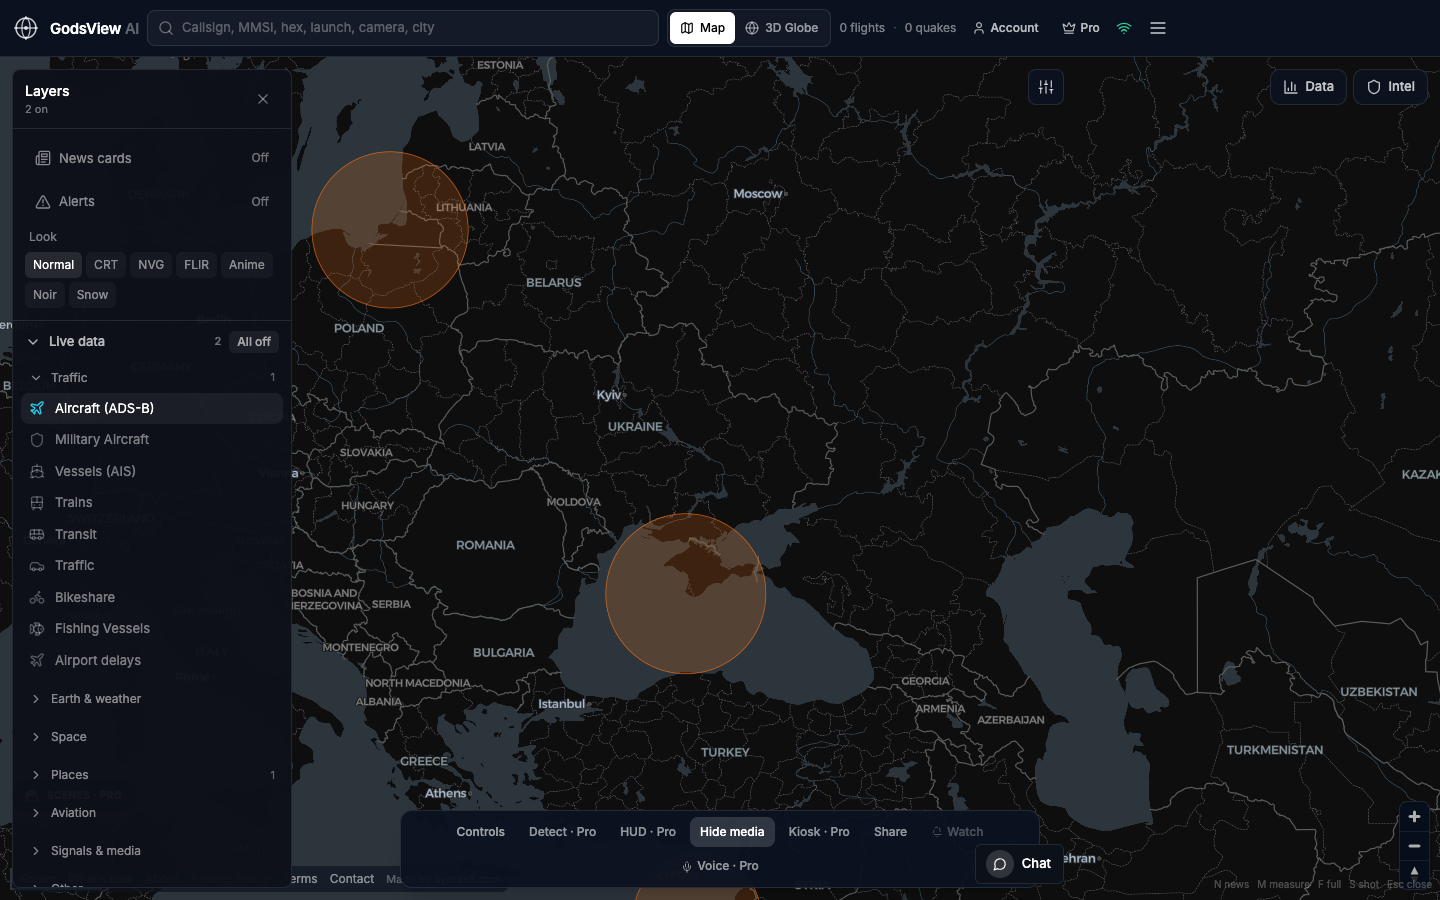
GodsView's Middle East live map frames the Gulf, and the GPS jamming map shows known interference zones and aviation SIGMETs that mention GPS or GNSS interference.
Bab el-Mandeb and the Red Sea
The Bab el-Mandeb lies between the Horn of Africa and the Arabian Peninsula and connects the Red Sea to the Gulf of Aden. Together with the Suez Canal it forms the shortest sea route between Asia and Europe. After Houthi attacks on commercial ships began in November 2023, oil flows through the strait fell from 8.7 million b/d in 2023 to 4.0 million b/d in the first eight months of 2024, while flows around the Cape of Good Hope rose from 6.0 to 9.2 million b/d (EIA).
Traffic is returning slowly. Lloyd's List Intelligence counted 1,215 Bab el-Mandeb transits in September 2026, up 16% year on year but still 47% below pre-crisis levels, and noted an attack on a containership in the southern Red Sea on 7 October 2026 (Lloyd's List Intelligence).
Open the Red Sea live map to watch the southern approaches. Container ships entering the Red Sea northbound are the clearest sign that carriers are returning.
Suez Canal
The Suez Canal and the parallel SUMED pipeline in Egypt connect the Red Sea with the Mediterranean (EIA). Their fortunes track the Red Sea. In September 2026 the canal handled 1,228 transits, 21% more than a year earlier but 39% below pre-Houthi levels (Lloyd's List Intelligence).
On the map, watch the anchorages at the canal's northern and southern ends and the mix of ship types entering. A rising share of large container ships is the clearest sign that the Asia-Europe route is coming back.
Strait of Malacca and Singapore
The Strait of Malacca links the Indian Ocean and the Pacific and is the shortest sea route between Middle East suppliers and East Asian markets. EIA calls it the world's largest chokepoint by oil transit volume, at 23.2 million b/d in the first half of 2025 (EIA).
Because it runs past major ports, it is one of the best-covered stretches of water for terrestrial AIS. On a live map it looks like a dense two-way highway with large anchorages off Singapore. Useful signals are the size of those anchorages and ships slowing or bunching up in the Singapore Strait. The South China Sea live map covers the eastern approaches.
Panama Canal
The Panama Canal is about 50 miles long and links the Pacific with the Caribbean and the Atlantic; its oil flows were about 2.3 million b/d in fiscal 2025 (EIA). Unlike the straits, it depends on fresh water from Gatun Lake to operate its locks. When rainfall is low, the Panama Canal Authority limits ship draft. In 2026 it announced cuts in the maximum draft at the Neopanamax locks to 48 feet from 26 August and 47.5 feet from 3 September (Marine Insight).
On the map, watch the anchorages at both ends. Longer queues and ships reporting lower draughts suggest restrictions are biting.
Turkish Straits (Bosporus and Dardanelles)
The Bosporus is a 17-nautical-mile waterway that is less than half a nautical mile wide at its narrowest point, and the Dardanelles runs 37 nautical miles; together they carried about 3.7 million b/d of oil in the first half of 2025 (EIA). Ships pass through the middle of Istanbul, so AIS coverage is dense. Watch the anchorages at each end for queues, especially of tankers coming out of the Black Sea.
Strait of Gibraltar and Taiwan Strait
Strait of Gibraltar
The Strait of Gibraltar joins the Atlantic Ocean and the Mediterranean between Spain and Morocco. It is the western gate of the Mediterranean, so ships that use the Suez route to or from the Atlantic pass through it. Changes in Red Sea routing therefore show up here too, as shifts in the mix of ships entering and leaving the Mediterranean. With busy ports on both shores, it is easy to watch on a terrestrial AIS map.
Taiwan Strait
The Taiwan Strait separates Taiwan from mainland China and carries traffic between Northeast Asia and Southeast Asia and beyond. According to data compiled by Bloomberg, 48% of the world's container fleet passed through it in the first seven months of 2022 (Bloomberg). During military exercises, watch whether merchant ships reroute east of Taiwan. The Taiwan live map frames the strait and its approaches.
How to read chokepoint traffic on a live map
Single ships rarely tell you much. Patterns do. Here is a checklist that works for any of the passages above.
- Count transits in each direction over a fixed window, such as six hours, and compare with the same window on other days.
- Watch the anchorages. Growing clusters of ships with speed near zero outside a canal or port mean waiting.
- Look at speed and course. A line of ships slowing, loitering or turning back is a stronger signal than one ship stopping.
- Note AIS gaps. Ships that disappear near a chokepoint and reappear later may have gone dark, left coverage or been affected by interference.
- Check for interference. Open the GPS jamming layer before treating odd tracks as real movement. Our explainer on GPS jamming and spoofing shows what interference looks like.
- Cross-check with official sources. Maritime security advisories, port authority notices and trade press report what AIS cannot.
If you are new to AIS, start with what is AIS ship tracking? and how to track a ship.
Using GodsView for chokepoint monitoring
GodsView shows live ships from the aisstream.io terrestrial AIS stream, refreshed about every 30 seconds, free in the browser with no account needed to view. The Ops Center, also free to view, merges reports of the same incident from many sources into a scored incident register, which helps when a chokepoint is in the news.
GodsView Pro ($10.99/month, $99.99/year or $199.99 lifetime, as of October 2026) adds watch-area alerts when ships enter an area you draw, vessel arrival and departure alerts, and infrastructure layers such as ports, oil and gas facilities and submarine cables. Teams following trade lanes can start from the logistics live map or the insurance and risk page.
What a live map cannot tell you about chokepoints
| Limit | Why it matters |
|---|---|
| AIS counts only ships that transmit | JMIC notes AIS-derived transit figures may miss ships with AIS disabled or affected by GNSS disruption |
| Terrestrial coverage ends offshore | Ships detouring around Africa may vanish from free maps for days |
| GNSS interference creates false tracks | Ships can appear over land or at impossible speeds |
| AIS carries no cargo data | You can see a tanker, not what or how much it carries |
| Live maps are not security advisories | Threat levels and routing guidance come from naval and maritime security authorities |
Sources: JMIC advisory, Canadian Coast Guard on AIS range.
Live maps show what ships report about themselves. In a conflict, reporting changes, and the most important vessels may be the ones you cannot see. The same caution applies to conflict maps in general; see how live conflict maps work. Never use a public tracker for safety-of-life or routing decisions at sea; follow official maritime security guidance. Our methodology page lists every source and refresh interval GodsView uses.
The short version
Malacca and Hormuz carry the most oil, the Red Sea and Suez carry the shortest Asia-Europe route, and Panama depends on rainfall. In 2026, Hormuz has been the most disrupted and the Red Sea is slowly reopening. On a live map, count transits, watch anchorages and check for interference before drawing conclusions, and use official advisories to confirm what the dots suggest. Comparing trackers for this work? See our MarineTraffic alternatives roundup.
Monitor chokepoints on the live map
Frequently asked questions
What are the most important shipping chokepoints in the world?
By oil volume, EIA ranks the Strait of Malacca (23.2 million b/d) and the Strait of Hormuz (20.9 million b/d) highest for the first half of 2025, followed by the Suez Canal and SUMED pipeline, the Danish Straits, the Bab el-Mandeb, the Turkish Straits and the Panama Canal. The Taiwan Strait and the Strait of Gibraltar are also major container and general shipping routes.
Is the Strait of Hormuz open to shipping?
Shipping through Hormuz has been severely disrupted since regional hostilities began on 28 February 2026. Transits have partly recovered at times, but attacks on tankers continued into October 2026 and maritime security assessments described the threat as severe. Conditions change quickly, so check current advisories from maritime security authorities rather than relying on a live map alone.
Are ships going through the Red Sea again?
Some are. Lloyd's List Intelligence counted 1,228 Suez Canal transits and 1,215 Bab el-Mandeb transits in September 2026, both higher than a year earlier but still 39% and 47% below pre-crisis levels. Container lines have been returning gradually, while attacks and threats in the southern Red Sea continue to affect routing decisions.
Can I see ships in the Strait of Hormuz on a live map?
Yes, ships that transmit AIS near the coast are visible on terrestrial AIS maps such as the GodsView ship tracker. Keep in mind that some ships switch AIS off in high-risk areas, and GNSS interference around the Gulf can produce false positions, so counts and tracks there should be read with caution.
Why do ships go around the Cape of Good Hope?
Ships take the long route around southern Africa when the Red Sea and Suez Canal are too risky or too expensive to use. EIA data show oil flows around the Cape rose from 6.0 million b/d in 2023 to 9.2 million b/d in the first eight months of 2024 after attacks on shipping began in the Red Sea.
Sources
- EIA — World Oil Transit Chokepoints (updated March 2026)
- EIA — Strait of Hormuz remains a critical oil chokepoint (June 2025)
- EIA — Red Sea and Bab el-Mandeb oil flows (October 2024)
- JMIC — Advisory note update 030, 9 April 2026
- Lloyd's List Intelligence — Strait of Hormuz brief, 12 October 2026
- Lloyd's List Intelligence — Red Sea brief, 15 October 2026
- Marine Insight — Panama Canal draft restrictions (2026)
- Bloomberg — Taiwan tensions raise risks in one of busiest shipping lanes (2022)
- Canadian Coast Guard — How AIS works on board ships
Facts checked on against each provider's own site.