Guide
NOAA Aurora Forecast: How to Read the Northern Lights Dashboard
NOAA's Space Weather Prediction Center runs the forecasts that almost every aurora app is built on. Its dashboard packs five products onto one page. Here is what each one tells you, how far ahead it looks, and how to turn it into a yes or no for tonight.
Key takeaways
- NOAA's aurora forecasts come from the Space Weather Prediction Center (SWPC), whose website now lives at spaceweather.gov; the old swpc.noaa.gov links redirect there.
- The 30-minute aurora forecast (the OVATION map) looks 30 to 90 minutes ahead, the time solar wind takes to travel from the L1 point 1.6 million km upstream to Earth.
- The experimental viewline shows how far from the pole aurora may be seen tonight and tomorrow night, based on the highest Kp forecast between 6 pm and 6 am US Central Time.
- The 3-day forecast gives Kp in 3-hour blocks of UTC time and is issued every 12 hours, at 00:30 and 12:30 UTC. A G1 storm is Kp 5; G5 is Kp 9.
- GodsView turns the same NOAA Kp and OVATION data into a city-by-city answer that also checks cloud cover, darkness and the Moon, free on its aurora forecast pages.
To read NOAA's northern lights forecast, start with two products: the 30-minute aurora forecast (the green OVATION oval) tells you whether the aurora is active right now and for the next 30 to 90 minutes, and the 3-day forecast tells you the highest Kp expected in each 3-hour block over the next three days. The experimental viewline turns that Kp into a line on the map: if you are poleward of the line tonight, you may see aurora on your horizon. Then check clouds and darkness, because NOAA's forecasts do not.
NOAA's Space Weather Prediction Center (SWPC) puts all of these on its Aurora Dashboard. This guide reads it panel by panel. For the broader how-to of a night out, see can I see the northern lights tonight, and for what each Kp number means where you live, what Kp index you need.
Check tonight's aurora forecast for your city
What NOAA's aurora forecast is
SWPC is the US government's official source of space weather forecasts and alerts, part of the National Weather Service. Its website now lives at spaceweather.gov; the familiar swpc.noaa.gov addresses redirect there, so old bookmarks still work.
Its aurora products are built on two kinds of data:
- Kp index forecasts. Kp is a planetary measure of geomagnetic activity from 0 to 9, given in 3-hour blocks. SWPC forecasters issue it up to three days ahead.
- Solar wind measured upstream. Spacecraft at the L1 point, about 1.6 million km (1 million miles) toward the Sun, measure the speed and magnetic field of the solar wind before it reaches Earth. DSCOVR and ACE have done this for years, and SWPC says newer spacecraft are coming online in 2026.
The forecasts tell you how strong and how far equatorward the aurora should be. They do not know your local weather, light pollution or the Moon, which is why you combine them with a cloud forecast.
The NOAA Aurora Dashboard, panel by panel
| Panel | What it shows | Looks ahead | Use it to decide |
|---|---|---|---|
| Space weather conditions | NOAA R, S and G scale levels: latest and 24-hour maximum | Now | Whether a geomagnetic storm (G) is under way |
| Tonight's aurora viewline | A line showing how far from the pole aurora may be visible | Tonight | Whether your area is in range tonight |
| Tomorrow night's viewline | The same for the next night | About 24 to 36 hours | Whether to plan a trip tomorrow |
| Aurora 30-minute forecast | OVATION map of aurora intensity, north and south | 30 to 90 minutes | Whether to go outside now |
| Planetary K index | Observed Kp in 3-hour bars, linked to the 3-day forecast | Past days, next 3 days | How active it has been and will be |
The dashboard's own legend sums up the Kp side: Kp 3 means quiet aurora, Kp 5 moderate, Kp 7 active and Kp 9 very active.
How to read the 30-minute aurora forecast (OVATION)
The 30-minute forecast is a pair of globes, one over each pole, with the aurora drawn as an oval around the magnetic pole. It comes from the OVATION model (Oval Variation, Assessment, Tracking, Intensity, and Online Nowcasting), developed at the Johns Hopkins University Applied Physics Laboratory, which takes the solar wind speed and magnetic field measured at L1 as input.
What to look for:
- Where the oval reaches. Green shows aurora; the oval turns red where the aurora is forecast to be more intense.
- How far you are from it. You do not need the oval overhead. SWPC says aurora can be seen from as much as 1,000 km away when it is bright and conditions are right, low on the poleward horizon.
- Which side is in darkness. The map shows the day-night line. Aurora on the daylit side is invisible to you.
- The lead time. The forecast is only as far ahead as the solar wind's travel time from L1 to Earth, 30 to 90 minutes. It is a nowcast, not a plan for tomorrow.
Northern hemisphere users read the north globe; the southern globe covers the aurora australis over Tasmania, New Zealand, southern South America and Antarctica.
How to read the aurora viewline for tonight and tomorrow night
The viewline products are labelled experimental. Each is a map of North America with the predicted oval and a line equatorward of it. If you are poleward of the line, aurora may be visible low on your horizon.
Three details change how you read it:
- It is based on the highest Kp forecast between 6 pm and 6 am US Central Time. If the strong period falls in daylight where you are, the line can look better than your night will be.
- "Tomorrow night" becomes "tonight" at 12:00 UTC, within an hour of the end of that 6 pm to 6 am window.
- It covers North America. Viewers in Europe or Oceania get more from the Kp forecast and a latitude rule, or from a city-level forecast.
How to read the 3-day Kp forecast
The 3-day forecast is a one-page text product issued every 12 hours, at 00:30 and 12:30 UTC. It lists the forecast Kp for each 3-hour block (00-03 UT, 03-06 UT and so on) for three days, the chance of radio blackouts (R) and solar radiation storms (S), and a short written rationale from the forecaster.
To use it:
- Convert the blocks to your time zone. The 06-09 UT block is 1 am to 4 am in New York and 6 am to 9 am in London in winter.
- Find the highest Kp during your dark hours. That is the number that matters, not the daily maximum.
- Compare it with the Kp your place needs. Further from the magnetic pole means you need a higher Kp. The table below shows the rule GodsView uses.
- Treat day 2 and day 3 as a heads-up. Storm timing from a coronal mass ejection can shift by many hours.
NOAA's G scale and what each level means for the aurora
When forecasters expect Kp 5 or higher, they talk in terms of geomagnetic storms on NOAA's G scale. NOAA's own scale page says how far the aurora reaches in the US at each level and how often each happens in an 11-year solar cycle:
| G level | Kp | Name | Storm days per cycle | NOAA's US aurora example | Visible down to (geomagnetic latitude)* |
|---|---|---|---|---|---|
| Below G1 | 3 to 4 | Quiet to active | Not a storm | Not on the scale | About 57° to 55° |
| G1 | 5 | Minor | 900 | Northern Michigan and Maine | About 53° |
| G2 | 6 | Moderate | 360 | New York and Idaho | About 51° |
| G3 | 7 | Strong | 130 | Illinois and Oregon | About 49° |
| G4 | 8 | Severe | 60 | Alabama and northern California | About 47° |
| G5 | 9 | Extreme | 4 | Florida and southern Texas | About 45° |
*The last column is the rule GodsView uses on its aurora pages: the classic NOAA relation for the oval's equatorward edge overhead (66.5° minus 2.05° per Kp step), less about 3° for an aurora seen low on the horizon. Geomagnetic latitude is not the same as the latitude on a map: Minneapolis sits at about 53.5° geomagnetic and needs about Kp 5, Seattle and Toronto about Kp 6, Chicago and New York City about Kp 7, while Oslo needs about Kp 2 and Fairbanks can see aurora on quiet nights.
Bz and solar wind speed: the two numbers to watch on a storm night
NOAA's real-time solar wind page plots data from the active L1 spacecraft: magnetic field strength (Bt), its north-south component (Bz), and the wind's speed, density and temperature. On a storm night, two of them matter most:
- Bz. When Bz points south (negative values, in nanotesla), the solar wind's field connects with Earth's and energy pours in. A strongly negative Bz that stays south for an hour or more is the classic sign that the aurora is about to brighten. A northward Bz can stall even a strong storm.
- Speed. Faster wind carries more energy. Background solar wind is often around 300 to 400 km/s; faster streams and coronal mass ejections push it much higher.
These readings are what feed the OVATION nowcast, so a change in Bz shows up on the 30-minute map soon after.
: NOAA's 3-day chances of radio blackouts, solar radiation storms and geomagnetic storms, with Kp 1.7, solar wind 332 km/s and Bz -1 nT.)
How GodsView uses NOAA's aurora data
GodsView reads the same NOAA SWPC feeds, the planetary Kp forecast and the OVATION aurora grid, and adds what NOAA leaves out: your local weather and the dark hours.
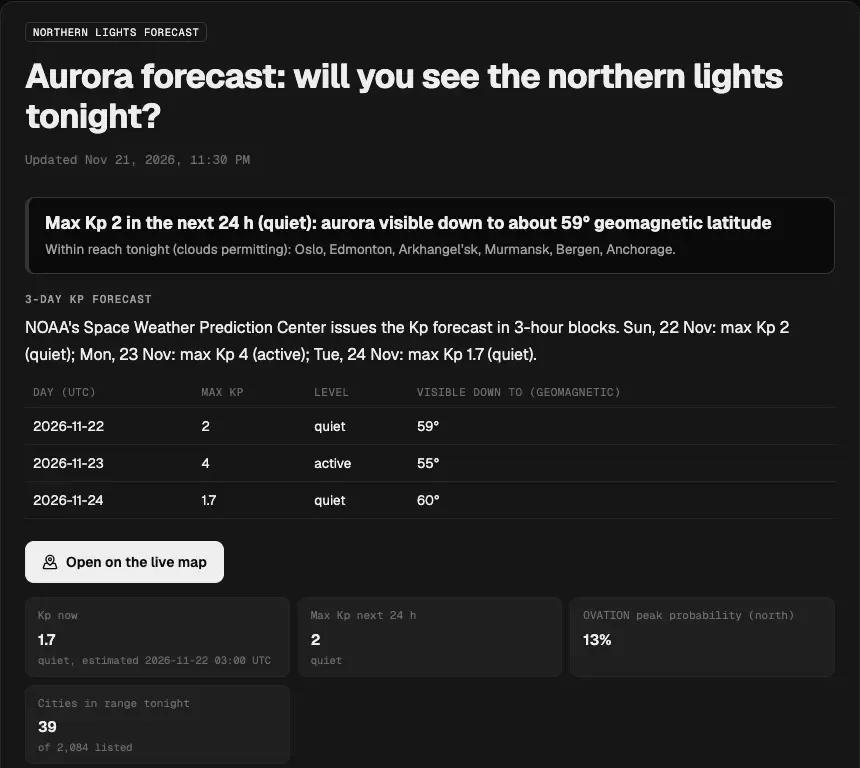
- The aurora forecast hub shows Kp now, the 3-day Kp forecast by UTC day with how far the aurora should reach, the OVATION peak probability in the north, and how many cities are in range tonight.
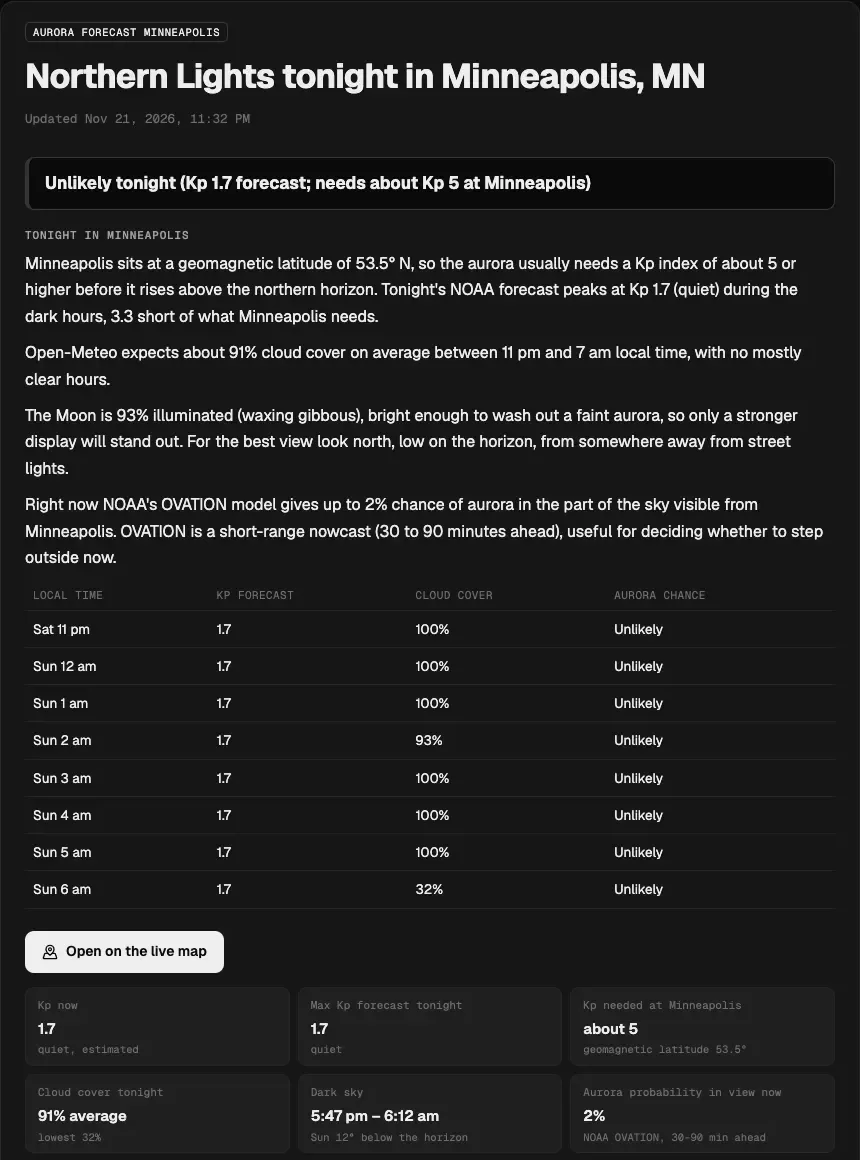
- City pages such as Minneapolis, Fairbanks, Edinburgh or Tromsø work out the Kp the city needs from its geomagnetic latitude, then list each dark hour tonight with the forecast Kp, the cloud cover from Open-Meteo and an aurora chance. They also give the Moon's phase and the OVATION probability for the part of the sky the city can see.
- The space weather page shows NOAA's R, S and G scales now and for three days, the latest Kp, solar wind speed and Bz, the X-ray level and solar flux, with city versions that explain local effects on GPS, radio and the aurora.
All of these pages are free and need no sign-in. For a wider view of what is happening overhead, open the God's eye view of the world, live with a free account; the space weather layer on the map is part of GodsView Plus.
A five-minute routine for aurora nights
- Afternoon: read the 3-day forecast. Is the highest Kp during your dark hours at or above what your place needs?
- Evening: check the viewline for tonight (North America) or your city's aurora page for clouds and darkness.
- After dark: watch Bz and speed on the solar wind page. A sustained southward Bz is the go signal.
- Before you leave: look at the 30-minute OVATION map. If the oval has brightened and pushed toward you, go.
- Outside: face the pole, away from lights, and give your eyes 15 to 20 minutes. Phone cameras often pick up aurora the eye sees as grey.
If storms are your interest beyond the aurora, solar flares and geomagnetic storms explained covers what the R, S and G scales do to GPS, radio and power grids, and what causes the northern lights explains the physics.
See tonight's aurora chances by city
Frequently asked questions
Where is the NOAA northern lights forecast?
On the Space Weather Prediction Center's website, which now lives at spaceweather.gov (swpc.noaa.gov links redirect there). The Aurora Dashboard brings together the 30-minute aurora forecast, tonight's and tomorrow night's viewlines, the Kp index and the current NOAA scales.
How far ahead does the NOAA 30-minute aurora forecast look?
About 30 to 90 minutes. That is how long the solar wind takes to travel from the L1 point, about 1.6 million km upstream, to Earth. Use it to decide whether to go outside now, and the 3-day Kp forecast to plan ahead.
What do the colors on the NOAA aurora map mean?
The oval is drawn in green where aurora is expected and turns toward red where it is forecast to be more intense. You do not need to be under the oval: bright aurora can be seen from up to about 1,000 km away, low on the horizon.
What Kp does NOAA forecast for a geomagnetic storm?
Kp 5 is a G1 (minor) storm, Kp 6 is G2, Kp 7 is G3, Kp 8 is G4 and Kp 9 is G5 (extreme). NOAA says G1 aurora is commonly visible in northern Michigan and Maine, and G5 as far south as Florida and southern Texas.
How accurate is the NOAA aurora forecast?
The 30-minute forecast is based on measured solar wind, so it is the most reliable but short. The 3-day Kp forecast is a forecaster estimate; the arrival time of a coronal mass ejection can be off by many hours, and its strength depends on the direction of its magnetic field, which is only known when it reaches L1.
Does the NOAA forecast include clouds?
No. NOAA forecasts the aurora, not the local weather. GodsView's city aurora pages combine NOAA's Kp and OVATION data with hourly cloud cover, darkness and the Moon for each city.
Sources
- NOAA SWPC — Aurora Dashboard (Experimental)
- NOAA SWPC — Aurora 30-Minute Forecast
- NOAA SWPC — Aurora Viewline for Tonight and Tomorrow Night (Experimental)
- NOAA SWPC — 3-Day Forecast
- NOAA SWPC — NOAA Space Weather Scales
- NOAA SWPC — Real Time Solar Wind
Facts checked on against each provider's own site.