Explainer
How Live Conflict Maps Work and How to Read Them
A live conflict map is a stream of claims pinned to coordinates. Knowing how those pins get there, and how often they move later, is the difference between being informed and being misled.
Key takeaways
- Live conflict maps plot reports, not ground truth: news, official statements, social posts and geolocated footage, each with a different reliability.
- Event maps (pins), frontline maps (shaded control) and curated datasets work differently and update on very different schedules.
- Geolocation and corroboration take time, so the most verified picture is usually hours or days behind the fastest one.
- Read every pin with its source, timestamp and precision in mind, and never use a conflict map for personal safety decisions.
Live conflict maps work by collecting reports of incidents (from news outlets, official statements, social media and geolocated photos or videos), assigning each report a location and time, and plotting it on a map that updates as new reports arrive. Some maps also draw frontlines or areas of control, which are analysts' judgments built from many such reports rather than a direct measurement.
That distinction matters. A conflict map is not a sensor feed like an aircraft tracker; it is an editorial product. Somebody, or some algorithm, decided that a report was credible enough to plot, chose where to put the pin, and picked an icon. Every one of those choices can be right, wrong, early or late.
This guide explains the main types of conflict map, the pipeline from raw report to pin, how geolocation and verification work, why maps lag and disagree, and a practical checklist for reading them without spreading errors.
What is a live conflict map?
A live conflict map is any map that shows security events (strikes, clashes, protests, explosions, troop movements) as they are reported. In practice they fall into three families, and many products mix them.
| Type | What it shows | Typical update speed | Main risk |
|---|---|---|---|
| Event (pin) maps | One marker per reported incident, linked to a source | Minutes | Unverified early claims |
| Frontline / control maps | Shaded areas showing who holds territory | Daily or several times a week | Simplifies contested, fluid ground |
| Curated event datasets | Coded records of events, fatalities and actors for analysis | Weekly or slower | Lag; not meant for breaking news |
| Machine-coded news streams | Events extracted automatically from news text | About every 15 minutes | Misplaced or duplicated events |
Event maps
Event maps such as Liveuamap present breaking news as icons on a map, each tied to a short description and a link to the source, with photos and videos where available, according to its app listing. Speed is the strength. The cost is that early reports in any crisis are often incomplete or wrong, so pins can be corrected or removed later.
Frontline maps
Frontline maps shade territory by who controls it. Examples include DeepStateMAP, a Ukrainian-run map of the war in Ukraine, and the daily control-of-terrain maps produced by the Institute for the Study of War with AEI's Critical Threats Project, which have published updates on the Russian invasion of Ukraine since February 2022. These maps are assessments: a shaded area means analysts judge it to be held, based on the evidence available to them.
Curated datasets and machine-coded streams
Research datasets sit at the slow, careful end. ACLED (Armed Conflict Location & Event Data) is a non-profit that collects, codes and maps data on political violence and protest worldwide; its researchers review reports from local, national and international media, vetted social media accounts, government and NGO reports, and local partner organizations, and ACLED says it does not crowdsource or scrape large volumes of social media (sourcing methodology).
At the fast, automated end, the GDELT Project monitors print, broadcast and web news in more than 100 languages and updates its event streams every 15 minutes. That breadth is useful for spotting where coverage is spiking, but automated extraction can misplace an event or count one incident many times.
Open the live geopolitical map
Where does conflict map data come from?
Every pin starts as a claim from somewhere. Knowing the source category tells you how much weight to put on it.
| Source type | Strengths | Weaknesses |
|---|---|---|
| Wire services and established outlets | Editorial standards, corrections policies, reporters on the ground | Slower; limited access to front areas |
| Official statements (militaries, ministries, police) | Authoritative on their own actions | Strategic incentives to exaggerate or omit |
| Local journalists and civil society | Local knowledge and context | Reach and safety constraints; can be partisan |
| Social media posts and channels | Fastest; often first footage | Propaganda, recycled old footage, misattribution |
| Geolocated photos and videos | Can pin an event to a precise spot | Location is not the same as cause or attribution |
| Sensor data (seismic, fire detection, flight and ship tracks) | Independent, instrument-based | Indirect; rarely explains what happened |
A strong map shows the source for every event and lets you open it. If a map gives you an icon with no source and no time, treat it as a rumor.
How sensor data helps
Independent instruments are the best cross-check because they have no stake in the narrative. Satellite fire detections, for example, can show heat at the location of a reported strike on a fuel depot; our guide to the NASA FIRMS wildfire map explains how those detections work and why they include false positives. Large explosions sometimes register on seismometers, visible on the live earthquake map.
Aircraft tracks add context too, with caveats. Many military aircraft fly without broadcasting, so their absence on a tracker proves nothing; military aircraft tracking explained covers why. Areas with heavy GPS interference often surround active conflicts, which is the subject of GPS jamming and spoofing explained.
How are events geolocated?
Geolocation means finding where a photo or video was taken by matching what is visible to maps and imagery. It is the core skill behind modern conflict mapping.
- Collect the earliest copy. Find the original upload and note its time. Re-uploads strip context and sometimes add false captions.
- List distinctive features. Road junctions, building shapes, towers, fences, shorelines, ridgelines, signs.
- Narrow the area. Use the claimed location, language on signs, vegetation and terrain to shortlist candidate areas.
- Match against imagery. Compare features with satellite and street-level imagery until several independent features line up.
- Estimate time. Shadows, weather and seasonal cues should agree with the claimed date.
- Record precision. A match to a specific building is very different from "somewhere in this town."
Geolocation answers where. It does not answer who or why. A video of a burning building can be precisely geolocated and still be misattributed to the wrong side or the wrong day. Our guide what is OSINT? covers the wider verification workflow, including preservation.
How do conflict maps verify reports?
Verification standards vary widely between products, which is why two maps can show different pictures of the same day. Common approaches:
- Source tiering. Some maps only plot reports from vetted outlets or accounts; others plot anything and label it as unconfirmed.
- Two-source rules. An event is confirmed only when independent sources agree.
- Geolocated evidence. Frontline changes are drawn only when footage or imagery places forces in a specific spot.
- Delayed coding. Research datasets wait for fuller reporting before coding an event, trading speed for accuracy.
- Corrections. Good maps update or remove pins and frontlines when evidence changes. Look for a visible correction policy.
A useful habit: whenever a map moves a frontline, ask what new evidence justified it. Credible projects either explain their methodology publicly or link the evidence for changes.
Why do live conflict maps lag or disagree?
People are often surprised that the "live" map does not match what they just saw on social media, or that two respected maps disagree. The reasons are structural.
Time to verify
Fast maps plot early claims; careful maps wait. The verified picture is usually hours or days behind the fastest one, and a curated research dataset can be weeks behind. ACLED, for example, offers aggregated data updated weekly (ACLED FAQ).
Fog of war and deliberate deception
Parties to a conflict restrict information, stage footage, and publish claims timed for political effect. Old videos are routinely recirculated as new. Front areas may have no connectivity at all, so the absence of reports can simply mean nobody could post.
Different definitions
"Control" can mean permanent presence, fire control, or simply that the other side has withdrawn. One map may shade a contested village as held, another as gray zone. Neither is necessarily wrong; they are answering slightly different questions.
Precision and placement
Many reports name only a town or district. Maps then place the pin at the town center, which can look precise while being kilometers off. Some datasets record a precision code; event maps usually do not show one.
Selection bias
Places with smartphones, connectivity and media attention generate far more reports than remote areas. A dense cluster of pins can mean more fighting, or simply more cameras.
How to read a live conflict map responsibly
Use this checklist every time you share or act on something from a conflict map.
| Question | Why it matters |
|---|---|
| What is the original source, and can you open it? | Pins without sources are rumors |
| When was it reported, in which time zone? | Old events often resurface as new |
| How precise is the location? | Town-center pins can be kilometers off |
| Is it confirmed by an independent source? | Single-source claims are often revised |
| Who benefits if this claim spreads? | Official and partisan sources have incentives |
| Has the map changed it since? | Corrections are normal; check before reposting |
A few further rules:
- Separate the event from the claim about it. "A blast was reported near X" is different from "side A struck X."
- Keep the uncertainty in your wording when you repost or brief others.
- Avoid publishing live positions of people or units. It can endanger civilians, journalists and aid workers.
- For personal safety decisions, follow official agencies and local authorities. A conflict map is not an evacuation tool.
Reporters working under deadline can find a fuller newsroom workflow in using a live map for journalism.
How GodsView handles conflict data
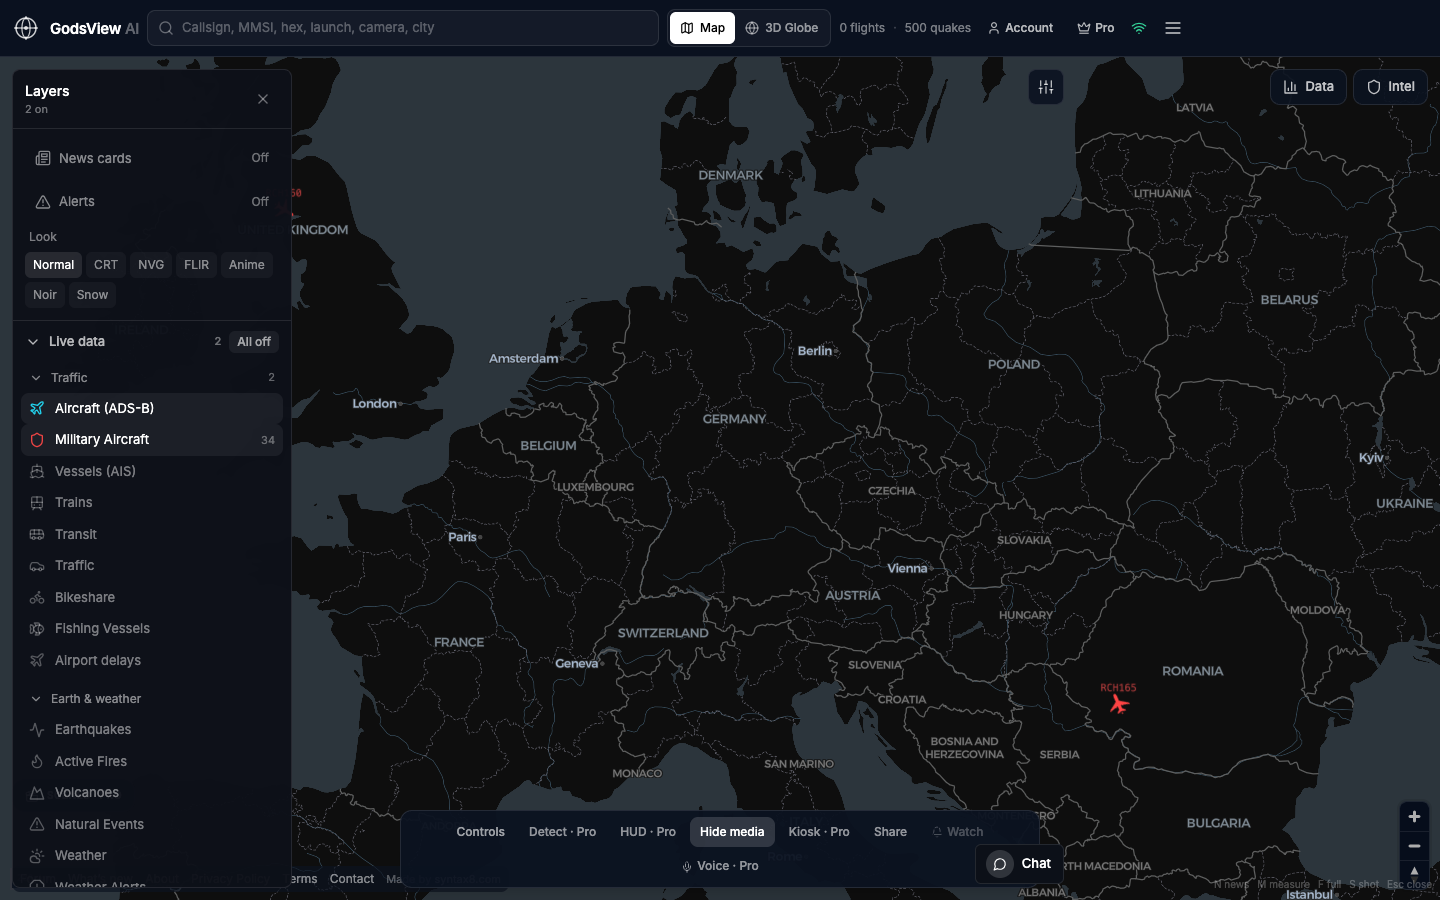
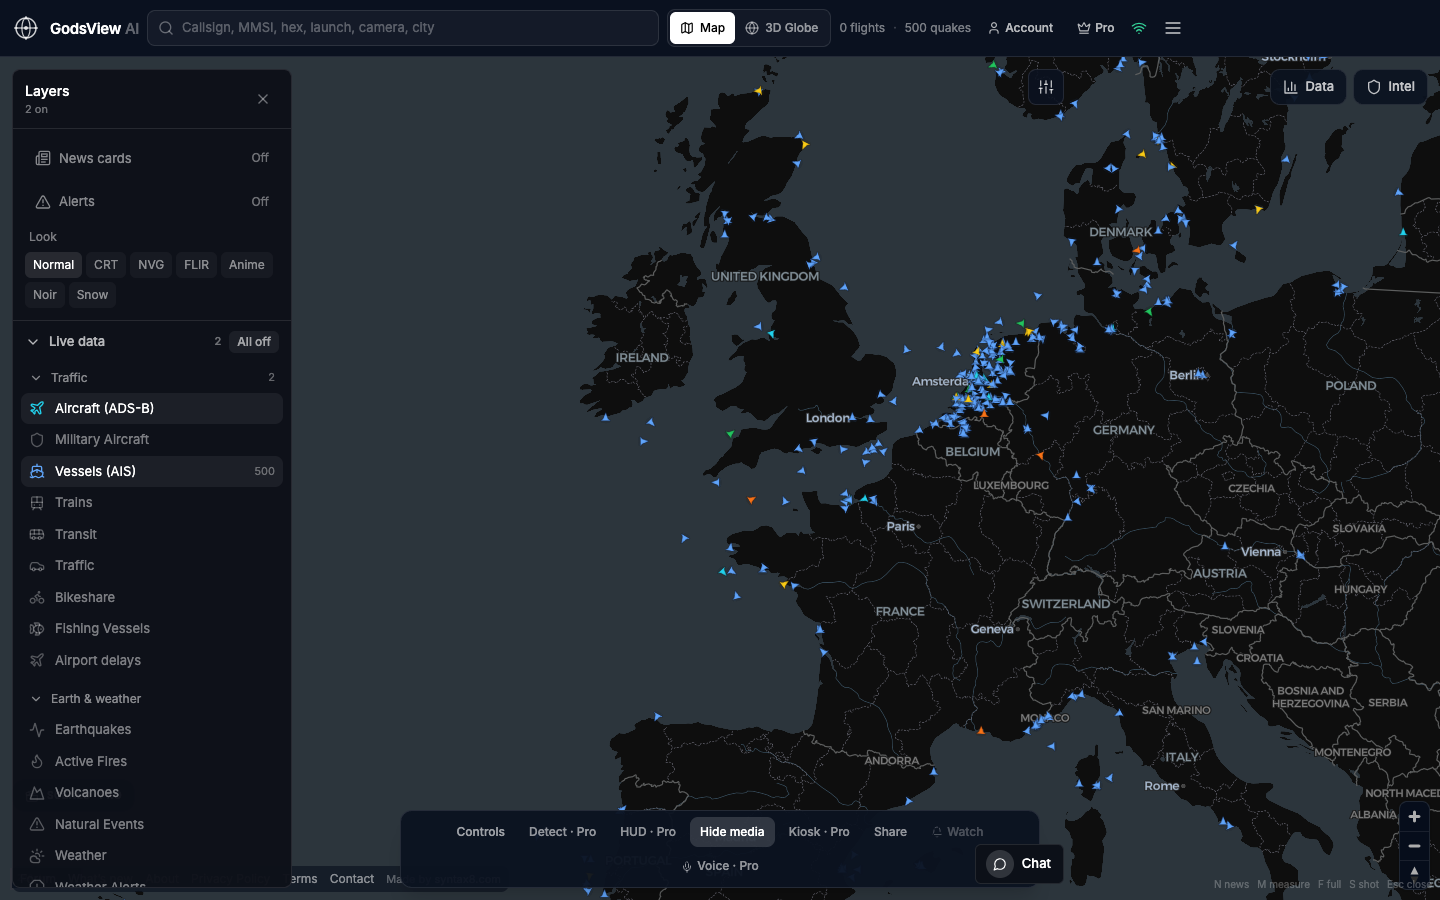
GodsView AI is a general live map rather than a dedicated war map, and it is open about which feeds sit behind each layer on its methodology page. Pro layers include conflict and geopolitical feeds and a Ukraine frontline layer sourced from DeepState, alongside free layers such as global news RSS, aircraft, ships, USGS earthquakes and NASA FIRMS fires. That combination lets you place a reported event next to independent sensor data on the Ukraine live map or the Middle East live map.
The Ops Center, free to view, merges reports of the same event from many sources (including GDELT, a 50+ outlet news wire, OSINT social posts, and military ADS-B and emergency squawks) into one incident and scores it from 0 to 100. That score helps you decide what to look at first; it is not a verification verdict, and the underlying sources still need checking.
For a side-by-side of dedicated conflict maps and broader intelligence maps, see the best live OSINT maps in 2026 and our Liveuamap alternatives guide.
What conflict maps cannot tell you
Even the best maps have hard limits:
- Casualty figures are among the least reliable early numbers and are frequently revised.
- Intent and attribution rarely come from a map. They come from investigation, often much later.
- Unreported areas stay blank. Silence is not peace.
- Troop strength and equipment cannot be inferred from pins or shading.
- The future. A frontline map shows a recent assessment, not a forecast.
Treat a conflict map as an index of claims to investigate and a way to see patterns across many reports, not as a substitute for careful reporting.
The short version
Live conflict maps turn a flood of reports into pins and shaded areas. Event maps are fast and noisy, frontline maps are slower assessments, and curated datasets trade speed for consistency. Geolocation tells you where something happened, not who did it or why.
Read every marker with its source, time and precision in mind, check claims against independent layers like fire detections and seismic data, keep your uncertainty visible when you share, and rely on official agencies for anything that affects your safety.
Frequently asked questions
How accurate are live war maps?
Accuracy depends on the map and the type of information. Event maps plot early reports quickly, so some pins are later corrected or removed. Frontline maps are analyst assessments updated daily or less often, and they simplify contested areas. Curated datasets like ACLED are more consistent but slower. Always open the source behind a marker and look for independent confirmation before relying on it.
Where do conflict maps get their information?
Most combine news reports, official statements, local journalists, social media posts and geolocated photos or videos. Some add sensor data such as satellite fire detections, seismic readings and aircraft tracks. Better maps show the source and time for every event so you can check it yourself. Automated streams like GDELT extract events from news text every 15 minutes, which is fast but noisier.
Why do two conflict maps show different frontlines?
They use different evidence thresholds, update on different schedules and define control differently. One map may shade a contested village as held while another marks it as a gray zone. Neither is necessarily wrong. Check each map's methodology and the evidence it cites for a change, and compare the dates of each update before drawing conclusions.
What does geolocation mean in OSINT?
Geolocation is the process of finding where a photo or video was taken by matching visible features (buildings, roads, terrain, shorelines) against satellite and street-level imagery. It can pin an event to a precise spot, but it does not establish who was responsible or exactly when. See our OSINT guide for the wider verification workflow.
Can you use a live conflict map to stay safe?
No. Conflict maps are delayed, incomplete and sometimes wrong, and they are not designed for personal safety decisions. Follow guidance from official agencies, your government's travel advisories and local authorities instead. Use maps for understanding and research, and avoid sharing live positions of people or units, which can put civilians, journalists and aid workers at risk.