Guide
Air Quality Index Near Me: How to Check Your AQI Today
Three apps, three different AQI numbers for the same street. Here is how to get a reliable air quality reading for where you are today, which index you are looking at, and when to trust a nearby sensor over a forecast model.
Key takeaways
- For a quick reading anywhere, open a city air quality page such as GodsView's air quality pages, which show the US AQI, PM2.5, PM10, ozone and a 48-hour forecast for thousands of cities, with no sign-in.
- In the United States, AirNow is the official source; its Fire and Smoke Map adds corrected PurpleAir sensor readings.
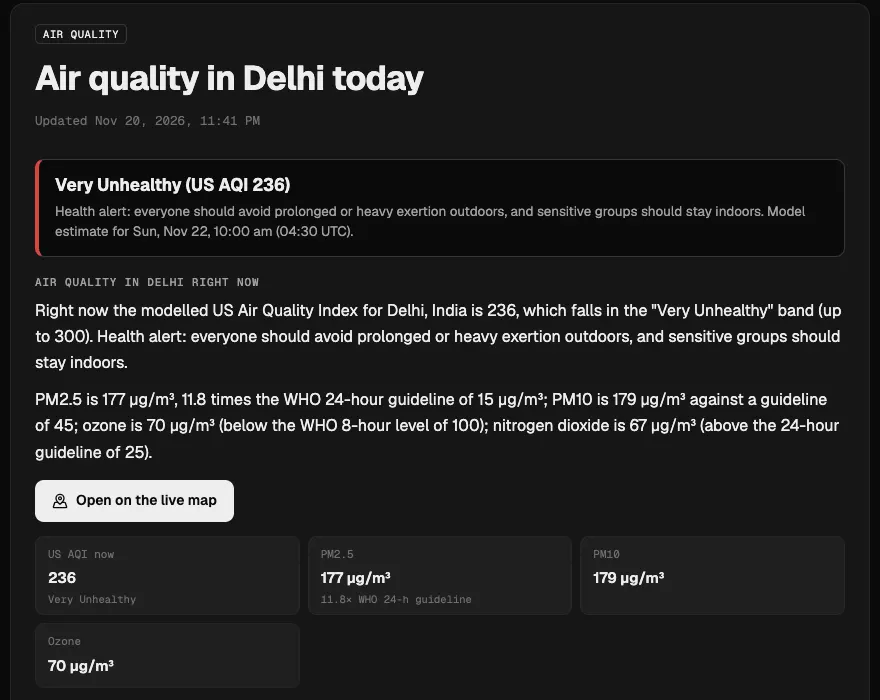
- Countries use different scales: the same air can be 236 on the US AQI, "Extremely poor" on the European index and about 340 ("Very Poor") on India's index.
- Model forecasts cover every city but can miss a busy road or a nearby fire; ground monitors and sensors measure the real air at one spot.
- Low-cost sensors read high in humid air unless corrected, which is why official maps apply an EPA correction to PurpleAir data.
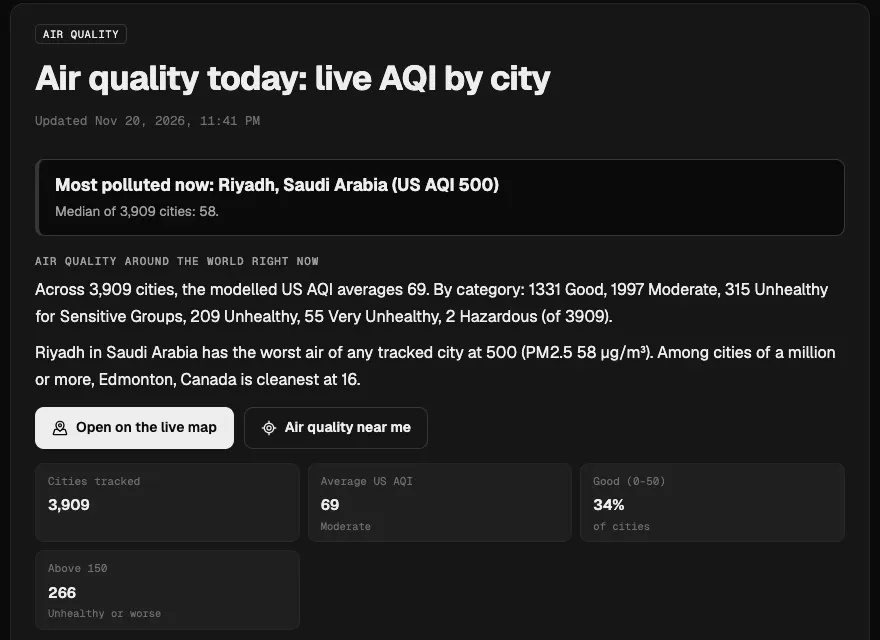
To check the air quality index near you, open an air quality page for your city. On GodsView, air quality today has a near me button that opens the page for your nearest city, and each city page, such as air quality in Delhi or Los Angeles, shows the current US AQI, PM2.5, PM10, ozone and nitrogen dioxide, a 48-hour forecast and the best hours to be outside. In the US, cross-check with AirNow, the official government source.
The rest of this guide explains where those numbers come from, why two apps can disagree by 100 points, and how to read a sensor next to a forecast. If you want to know whether a given number is safe, our guide what air quality index is bad? goes band by band.
The quick answer: where to check AQI today
| Where you are | Official or primary source | What GodsView adds |
|---|---|---|
| United States | AirNow (EPA and state agencies), Fire and Smoke Map | City pages with a 48-hour forecast and nearby cities |
| Canada | Environment and Climate Change Canada's AQHI | US AQI and PM2.5 by city for comparison |
| UK | Defra's Daily Air Quality Index (DAQI) | PM2.5, ozone and a European AQI value |
| European Union | European Environment Agency air quality index | Country pages ranking cities, e.g. Germany |
| India | CPCB National Air Quality Index (SAMEER app) | Country page ranking 260+ Indian cities, see India |
| China | Ministry of Ecology and Environment AQI | US AQI on the same pollutant values |
| Anywhere else | National agency if one exists | Modelled AQI for 3,900+ cities |
How to check the air quality where you are, step by step
- Open air quality today and tap Air quality near me, or search the list for your city. Your browser asks for your location once; it is only used to pick the nearest city page.
- Read the coloured box at the top: the US AQI right now and its band, from Good to Hazardous, with the matching health advice.
- Look at which pollutant drives the number. PM2.5 usually dominates in winter and during smoke; ozone peaks on sunny summer afternoons; nitrogen dioxide tracks rush-hour traffic.
- Scroll to the 48-hour forecast to see when the air will be cleanest. Particles often build up on calm nights and clear when wind or rain arrives.
- Check the "measured" note. If a sensor network has a PM2.5 reading within 25 km, the page shows it next to the model estimate.
- Compare with your official source (AirNow, AQHI, DAQI, CPCB) before making health decisions.
For a regional view, open your country page, such as air quality in Pakistan, which ranks tracked cities from cleanest to most polluted.
Where GodsView's air quality numbers come from
GodsView's city pages use the Open-Meteo Air Quality API, which serves forecasts from the European Copernicus Atmosphere Monitoring Service (CAMS): an 11 km model over Europe and a 45 km global model. That gives a value for every city on Earth, including places with no monitor at all. The page computes the US AQI from those concentrations, using 24-hour rolling averages for particles as the US method does, and also shows the European AQI.
Where a measured reading exists, the page adds the nearest PM2.5 cell from Sensor.Community or OpenAQ within 25 km, and checks NASA FIRMS for fire hotspots within 300 km to flag possible wildfire smoke. On the live globe, a god's eye view of the world, live, the Air Quality layer (part of Plus) puts these readings on the map next to fires, wind and weather.
Models have limits. They capture regional pollution, such as winter haze over the Indo-Gangetic Plain or a smoke plume crossing a continent, but they average over many kilometres, so they can miss a single busy road, a factory or a fire a few kilometres away. When the model and a nearby monitor disagree, trust the monitor for that spot and the model for the trend.
Why AQI apps disagree: the different indices
The single biggest reason two apps show different numbers is that they use different scales. An "AQI" is not one thing. Each country turns the same pollutant concentrations into its own index.
| Index | Used in | Scale | Bands |
|---|---|---|---|
| US AQI | United States, many apps worldwide | 0 to 500 | Good, Moderate, Unhealthy for Sensitive Groups, Unhealthy, Very Unhealthy, Hazardous |
| European Air Quality Index | European Union (EEA) | Six bands | Good, Fair, Moderate, Poor, Very poor, Extremely poor |
| Daily Air Quality Index (DAQI) | United Kingdom | 1 to 10 | Low (1-3), Moderate (4-6), High (7-9), Very High (10) |
| Air Quality Health Index (AQHI) | Canada | 1 to 10+ | Low (1-3), Moderate (4-6), High (7-10), Very High (10+) |
| National Air Quality Index (NAQI) | India | 0 to 500 | Good, Satisfactory, Moderately Polluted, Poor, Very Poor, Severe |
| AQI (HJ 633-2012) | China | 0 to 500 | Six levels from Excellent to Severely polluted |
Here is what that means in practice. On November 21, 2026, GodsView's Delhi page showed PM2.5 at 177 µg/m³ and a US AQI of 236, "Very Unhealthy". The same page showed a European AQI value above 100, which Open-Meteo labels "Extremely poor". On India's national index, a PM2.5 level of 177 held over 24 hours falls in the "Very Poor" band (301 to 400), at roughly 340. Same air, three numbers, three labels, all correct on their own scale.
Other reasons apps differ:
- Averaging time. US AQI uses a 24-hour average for particles, while AirNow's "current" figure uses the NowCast, which weights recent hours more. An app showing raw hourly PM2.5 will jump around more.
- Breakpoints change. In 2024 the US EPA tightened the PM2.5 breakpoints, so the same air now scores higher than before. Apps that never updated show lower numbers.
- Station versus model. One app may show the nearest monitor, another a model grid cell, another a crowd sensor on a balcony.
- Location. "Near me" can mean your exact point, your city centre or a monitor 20 km away.
Low-cost sensors: PurpleAir, Sensor.Community and others
Low-cost laser sensors have put thousands of PM2.5 readings on the map where there were none. They are useful, with two caveats.
First, they read high in humid air, because water droplets look like particles to the laser. The US EPA found that PurpleAir sensors consistently overestimate PM2.5 and built a US-wide correction equation. The AirNow Fire and Smoke Map applies that correction and quality checks before showing PurpleAir data, and leaves out sensors labelled indoor or that look faulty. If a raw PurpleAir reading looks far worse than AirNow, check whether the correction is turned on.
Second, a sensor measures one spot. One on a kitchen window above a busy street tells you about that street, not your whole town. Look for several sensors that agree.
GodsView uses the median of the sensors in a grid cell where Sensor.Community or OpenAQ data exists, and says on the page when there is no measured reading within 25 km, so you know you are looking at a model estimate.
Wildfire smoke and sudden bad air days
The most common reason the air quality index near you jumps overnight is smoke. A fire hundreds of kilometres away can push the AQI into the red when the wind turns. Smoke is mostly PM2.5, so it shows up first in the PM2.5 figure and on sensor maps.
To check whether smoke is the cause:
- Look for fire hotspots upwind on a map such as the live wildfire map or our guide to checking for fires near you.
- In the US and Canada, open the AirNow Fire and Smoke Map, which combines monitors, temporary smoke monitors and corrected sensors.
- Read the smoke note on GodsView's city page, which flags fire hotspots within 300 km when particle levels are high.
Indoors, a HEPA purifier and closed windows cut PM2.5 sharply. A well-fitted N95 or FFP2 mask helps outdoors; cloth and surgical masks do little against fine smoke.
Get an alert when the air turns bad
Checking every morning gets old. With GodsView Plus ($10.99 a month or $99.99 a year), you can save your home or a relative's town in My places and turn on the Unhealthy air (PM2.5) alert. It fires when PM2.5 nearby reaches 55.5 µg/m³, the start of the US "Unhealthy" band, and tells you when it reaches the very unhealthy level, by app notification, browser push or email. Our disaster alerts guide walks through setting it up with quake, storm and fire alerts.
In the US, AirNow's EnviroFlash emails and many state agencies' air quality alert days are worth adding too, because they come with local action advice.
See today's most and least polluted cities
Reading the number for your health
As a rough guide on the US scale, 0 to 50 is fine for everyone, 51 to 100 is fine for most people, and above 100 people with asthma, heart or lung disease, older adults, children and pregnant people should cut back on long or hard exercise outdoors. Above 150 everyone should. The detail, including what changed in 2024 and what each band means for running, school and work, is in what air quality index is bad?.
If you have symptoms such as wheezing, chest tightness or a racing heart on a bad air day, follow your doctor's plan and local health advice rather than any app.
Frequently asked questions
What is the air quality index near me right now?
Open air quality today and tap Air quality near me, or pick your city. The city page shows the current US AQI, PM2.5, PM10, ozone and a 48-hour forecast. In the US, compare it with AirNow, the official source.
Why do different apps show different AQI numbers?
They use different indices (US, European, UK, Indian, Chinese), different averaging times, different breakpoints and different data: a nearby monitor, a crowd sensor or a forecast model. A 100-point gap between apps is common on polluted days.
Is the AQI on GodsView measured or modelled?
Mostly modelled, from CAMS forecasts served by Open-Meteo, which cover every city. Where Sensor.Community or OpenAQ has a PM2.5 reading within 25 km, the page shows that measured value too and says when there is none.
Are PurpleAir readings accurate?
They track changes well but read high in humid air. The US EPA built a correction that the AirNow Fire and Smoke Map applies before showing PurpleAir data. Use corrected values when comparing with official monitors.
What AQI is unhealthy?
On the US scale, above 100 is unhealthy for sensitive groups and above 150 is unhealthy for everyone. Other countries use different numbers for similar air; see what air quality index is bad for each band.
Can I get an alert when air quality is bad near my home?
Yes. GodsView Plus has an Unhealthy air (PM2.5) alert for saved places in My places, sent by app, browser push or email when PM2.5 nearby reaches 55.5 µg/m³.
Sources
- AirNow — About the Fire and Smoke Map
- US EPA — Technical approaches for the sensor data on the AirNow Fire and Smoke Map
- Open-Meteo — Air Quality API documentation
- European Environment Agency — European Air Quality Index
- UK Government — Using the Daily Air Quality Index (DAQI)
- Government of Canada — About the Air Quality Health Index
- National Air Quality Index (India) — categories
Facts checked on against each provider's own site.