Earthquakes
Best Earthquake Tracker Websites and What Each Is For
There is no single best earthquake website. There is a best one for the US, for Europe and the Mediterranean, for New Zealand, for Japan, for watching seismograms, and for seeing quakes next to everything else. Here is which is which.
Key takeaways
- USGS Latest Earthquakes is the reference worldwide map. It shows M2.5+ in the US and M4.5+ around the world in near real time, and its data feeds update every minute.
- EMSC is usually the fastest place to see a quake people felt in Europe and the Mediterranean, because it combines agency data with eyewitness reports and website traffic.
- For New Zealand use GeoNet, and for Japan use the Japan Meteorological Agency. National agencies see their own quakes first and in more detail.
- EarthScope's Seismic Monitor and Raspberry Shake are for seeing the waves themselves, not just dots on a map.
- GodsView puts the USGS catalog on a live map and adds plain-language pages for today's quakes, each country and thousands of cities, next to fires, storms and flights.
The best earthquake website depends on where you are and what you want to know. For a worldwide live earthquake map, USGS Latest Earthquakes is the reference: it is free, fast and every other map, including ours, leans on it. For a quake you just felt in Europe or around the Mediterranean, EMSC is often first. In New Zealand use GeoNet; in Japan, the Japan Meteorological Agency. If you want to see the seismic waves, try EarthScope's Seismic Monitor or Raspberry Shake. And if you want quakes in plain language, by city or country, next to wildfires, storms and flights, that is what the GodsView live earthquake map is for.
This page compares them side by side. It is about websites and maps. For phone apps that warn before shaking, see our separate guide to earthquake alert apps. For what to do in the minute after you feel something, see was that an earthquake just now?.
See every earthquake in the last 24 hours
Earthquake tracker websites compared (November 2026)
All of these are free to use. Facts below were checked against each provider's own pages on November 10, 2026.
| Website | Run by | Coverage | Best for | Felt reports |
|---|---|---|---|---|
| USGS Latest Earthquakes | US Geological Survey | M2.5+ in the US, M4.5+ worldwide by default | The reference map and data for the US and the world | Yes, Did You Feel It? |
| EMSC | Euro-Mediterranean Seismological Centre, a non-profit | Worldwide, strongest in Europe and the Mediterranean | Fast news of quakes people felt | Yes, via website and LastQuake app |
| GeoNet | Natural Hazards Commission, Earth Sciences New Zealand and LINZ | New Zealand | Every NZ quake, with shaking intensity | Yes |
| JMA | Japan Meteorological Agency | Japan | Official seismic intensity and tsunami warnings in Japan | Instrument-based intensity |
| Seismic Monitor | EarthScope Consortium (formerly IRIS) | M4.0+ worldwide | Teaching, and seeing waveforms from stations | No |
| Raspberry Shake StationView | Raspberry Shake community network | Wherever hobby and school stations are | Live readings from citizen seismographs | No |
| GodsView | GodsView (data from USGS) | Worldwide | Plain-language pages by city and country, on a live map with other hazards | Shows USGS felt counts on city pages |
USGS Latest Earthquakes: the reference map
If you only bookmark one earthquake site, make it this one. The USGS Latest Earthquakes map shows "magnitude 2.5+ earthquakes in the U.S. and magnitude 4.5+ earthquakes around the world" in real time and near real time (USGS). Each event links to a detail page with the magnitude, depth, location, and for bigger quakes the ShakeMap, the PAGER impact estimate and the Did You Feel It? reports.
The default view is the past day at magnitude 2.5 and up. The gear icon lets you switch to past week or past 30 days, all magnitudes, or significant quakes only. Circles are sized by magnitude and coloured by age. The USGS GeoJSON feeds that sit behind the map, and behind many other sites, are "updated every minute" (USGS feeds).
Best for: anyone, anywhere, as the starting point. Journalists and researchers should cite it.
Limits: outside the US, USGS mainly lists moderate and larger quakes, and small local quakes in other countries are better covered by national agencies. Early numbers are automatic and can change as seismologists review the event. The earthquake map guide explains magnitude types, depth and why the numbers move.
EMSC: fastest for quakes people felt
The European-Mediterranean Seismological Centre was founded in 1975 and is a non-governmental, non-profit association (EMSC). It collects data from seismological institutes and publishes earthquake information through its website, apps and social channels.
What makes EMSC different is that it treats people as sensors. When a quake is felt, many people rush to check the EMSC website, its mobile site, its social channels or its LastQuake app. EMSC watches for that "sudden increase in traffic" as a sign that "a seismic event has probably occurred and been felt by the population" (EMSC LastQuake). Witnesses can then file felt reports with simple cartoon pictures of the shaking, and add comments, photos and videos. The LastQuake app launched in 2014.
Best for: checking a quake you just felt, especially in Europe and around the Mediterranean. Seeing what other people near you felt.
Limits: the very first EMSC entries for a felt quake can be rough, and magnitudes may differ slightly from USGS or the national agency while everyone refines the solution. That is normal. Different agencies use different stations and methods.
GeoNet: the New Zealand reference
GeoNet is New Zealand's geological hazard monitoring system. It started in 2001 and is a partnership between the Natural Hazards Commission Toka Tū Ake, Earth Sciences New Zealand and Land Information New Zealand (GeoNet). It monitors earthquakes and tsunami, volcanoes, landslides and ground deformation.
GeoNet's quake lists lead with intensity, not just magnitude. It uses the Modified Mercalli Intensity scale as "a better indicator of an earthquake's effects on people and their environment", and labels shaking from unnoticeable through weak, light, moderate, strong and severe to extreme (GeoNet). It also collects felt reports through its app and website.
Best for: anyone in New Zealand. It will list small local quakes that never reach a worldwide map.
On GodsView, earthquakes in New Zealand gives a quick overview from the USGS catalog, but for a local quake, GeoNet is the source to trust.
JMA: official earthquake and tsunami information in Japan
In Japan, the Japan Meteorological Agency is the official source. When a quake strikes, JMA "immediately issues information on its hypocenter, magnitude and observed seismic intensity". If the intensity is 3 or greater, it issues a Seismic Intensity Information report "within one and a half minutes", and when a damaging tsunami is expected it issues tsunami warnings or advisories "within around two to three minutes" (JMA).
JMA runs about 200 seismographs and 600 seismic intensity meters of its own and collects data from more than 3,600 intensity meters run by local governments and others. Its intensity scale, called shindo, has ten levels: 0, 1, 2, 3, 4, 5 Lower, 5 Upper, 6 Lower, 6 Upper and 7. Those values are measured by instruments, not estimated from reports (JMA).
Best for: anyone in Japan or with family there. When a news story says "shindo 5 upper", JMA is the origin.
Limits: USGS and JMA often give slightly different magnitudes for the same quake. They use different magnitude types and networks; neither is wrong. See earthquakes in Japan on GodsView for the USGS view.
EarthScope Seismic Monitor: seeing the waves
Seismic Monitor started as an IRIS tool. On January 1, 2023, IRIS and UNAVCO merged to form the EarthScope Consortium, which now runs it (Carnegie Science). It shows "a beautiful map of the latest earthquakes in near-real time", with only quakes of magnitude 4.0 or greater drawn as circles sized by magnitude and coloured by age (IRIS). From there you can click through to seismic stations, recent ground motion records and teaching material.
Its location data comes from USGS. A recent quake may not appear right away if the local network has not yet reported it to USGS, and anything below M4.0 is not shown (IRIS FAQ).
Best for: classrooms and anyone curious about how a quake travels through the Earth.
Raspberry Shake: citizen seismographs
Raspberry Shake makes small seismographs built around the Raspberry Pi computer. Owners can stream their readings to a shared online network. StationView is the public "Raspberry Shake Network & EQ Activity Map", where you can find stations and quakes, and the ShakeNet app lets you connect to stations from your phone (Raspberry Shake).
Best for: seeing a live squiggle from a station near you, and for teaching. Watching a distant quake's waves arrive at a station in your own town is the most direct way to understand what a seismograph does.
Limits: it is not an official catalog. A sensitive instrument in a house can also pick up local noise. Use it to see shaking, and use USGS or your national agency to name the quake.
GodsView: quakes in plain language, next to everything else
GodsView does not run seismometers. It takes the USGS catalog and does three things with it.
- A live map. The live earthquake map shows USGS quakes with origin time, magnitude, depth and location. The data refreshes about every two minutes. You can switch on wildfires, storms, tsunami alerts, GDACS disaster alerts or flights on the same map, or open the 3D globe.
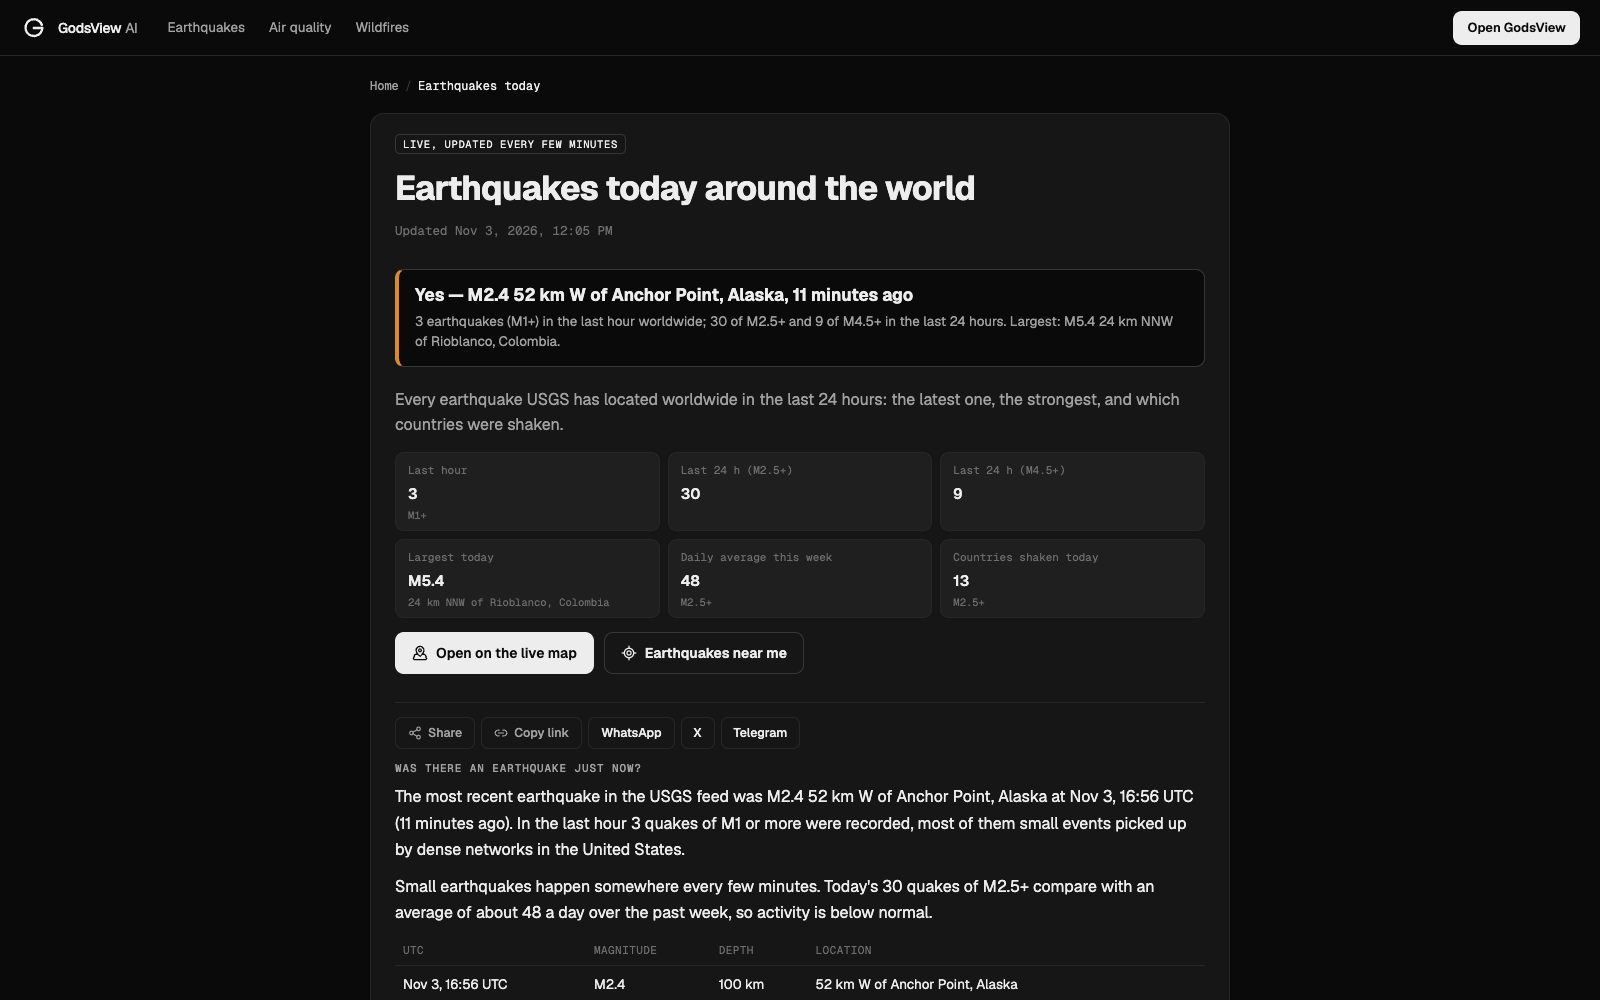
- Answer pages. Earthquakes today answers "was there an earthquake just now?" with the latest quake, counts for the last hour and day, the largest quakes and a breakdown by country. There are pages for each country and for thousands of cities at earthquakes near me. City pages show USGS Did You Feel It? counts and the tsunami status.
- Alerts. With GodsView Plus you can watch a place and get an alert for quakes near it, in the app, by browser push or by email. The disaster alerts guide walks through it.
Best for: a quick, readable answer, and seeing quakes in context, for example whether a fire, storm or volcano is active in the same area.
Limits: GodsView is only as fast as USGS, and it is not an early warning system. For small local quakes outside the US, the national agency will have more. For warnings before shaking, see the alert apps guide.
Which earthquake website should you use?
| You want to... | Use |
|---|---|
| Check the official worldwide record | USGS Latest Earthquakes |
| Find out what you just felt in Europe or the Mediterranean | EMSC |
| Check a quake in New Zealand | GeoNet |
| Check a quake or tsunami warning in Japan | JMA |
| Watch seismic waves arrive | EarthScope Seismic Monitor, Raspberry Shake |
| Get a plain answer by city or country, on a live map with other hazards | GodsView |
| Get warned before shaking | An alert app, not a website. See the alert apps guide |
A good routine after you feel something: check your national agency or EMSC first, because they see local quakes fastest. Then check USGS, which will usually catch up within minutes for anything moderate or larger. Then file a felt report. Your report helps scientists map the shaking.
Why the same earthquake looks different on different sites
People often notice that two websites disagree. A few reasons:
- Magnitude types. Agencies use different magnitude scales, especially in the first minutes. A quake can be M5.8 on one site and M6.0 on another.
- Automatic vs reviewed. The first numbers are calculated by computers and refined by seismologists. Sites update at different speeds.
- Different stations. A national network with dense local stations locates a quake differently from a global network.
- Time zones. USGS and many feeds work in UTC. A quake late in the evening local time may be "tomorrow" in UTC.
- Thresholds. A site that shows only M4+ will miss quakes another site lists.
None of this means one site is wrong. Use the national agency for local detail and USGS as the common reference. The earthquake map guide explains each of these in more depth.
Frequently asked questions
What is the best earthquake tracker website?
For a worldwide reference, USGS Latest Earthquakes. For felt quakes in Europe and the Mediterranean, EMSC. For New Zealand, GeoNet; for Japan, JMA. For plain-language pages by city and country on a live map with other hazards, GodsView.
How often does the USGS earthquake map update?
The USGS earthquake feeds behind the Latest Earthquakes map are updated every minute. The map shows M2.5+ quakes in the US and M4.5+ worldwide by default, and you can change the time window and magnitude in its settings.
Why is a small earthquake missing from the USGS map?
By default the map shows M2.5+ in the US and M4.5+ worldwide, and small quakes outside the US are often only in the national agency's catalog. Change the settings to all magnitudes, or check your national agency or EMSC.
Why do USGS and EMSC show different magnitudes?
They use different stations, methods and magnitude types, and early numbers are automatic. Differences of a few tenths are common in the first hour and usually shrink as the solutions are reviewed.
Is there a live earthquake map that shows other hazards too?
Yes. The GodsView live earthquake map shows USGS quakes and lets you add wildfires, storms, tsunami alerts, GDACS disaster alerts and flights on the same map.
Can a website warn me before an earthquake?
No website can do that reliably. Early warning comes from systems such as ShakeAlert, Android Earthquake Alerts and JMA, delivered to phones. See the earthquake alert apps guide.
Sources
- USGS: Latest Earthquakes
- USGS: GeoJSON summary feeds
- EMSC: History timeline
- EMSC: How LastQuake works
- GeoNet: About
- GeoNet: Earthquake intensity
- Japan Meteorological Agency: Earthquake information
- Japan Meteorological Agency: Seismic intensity scale
- IRIS / EarthScope: Seismic Monitor
- IRIS FAQ: Why is a recent earthquake not showing on Seismic Monitor?
- Raspberry Shake: About
- Carnegie Science: EarthScope Consortium launches January 1, 2023
Facts checked on against each provider's own site.