Storms
Worldwide Storm Tracker: Hurricanes, Typhoons, Cyclones
A hurricane, a typhoon and a cyclone are the same kind of storm. What changes from ocean to ocean is who forecasts it, what it is called, and how its strength is measured. Here is how the global system fits together, and how to see every active storm on one map.
Key takeaways
- Every ocean basin has an official forecast centre designated through the World Meteorological Organization: NHC in Miami, CPHC in Honolulu, JMA in Tokyo, IMD in New Delhi, Météo-France in La Réunion, Fiji in Nadi, plus warning centres in Australia, Indonesia, Papua New Guinea and New Zealand.
- The US military's Joint Typhoon Warning Center also issues warnings for the Pacific and Indian Oceans. Its numbers often differ from the official regional centre's.
- US agencies rate wind as a one-minute average; JMA and most others use ten minutes. The same storm can look weaker on a ten-minute scale.
- Category 3 in Australia, a "very strong typhoon" in Japan and a "very severe cyclonic storm" in India are different scales. Do not compare them directly with Saffir-Simpson categories.
- To see every active storm at once, use a map that merges official advisories from all basins, then check the regional centre for the area you care about.
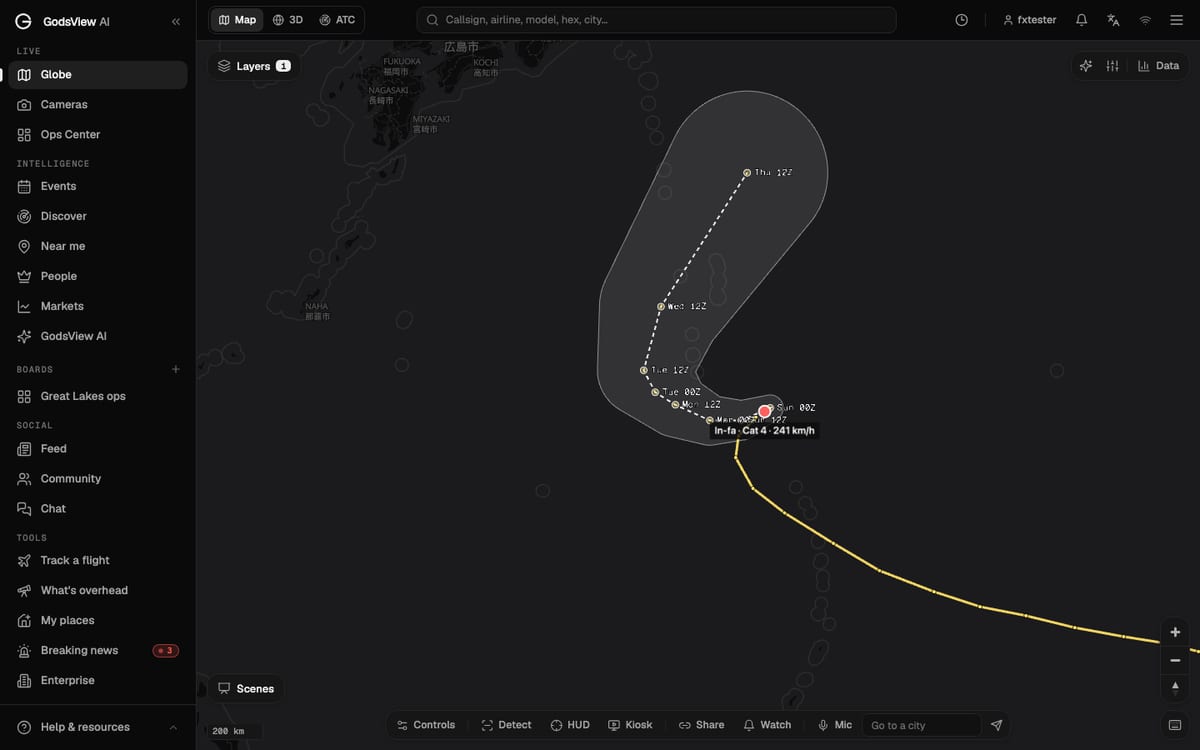
To track every hurricane, typhoon and cyclone in the world at once, use a map that merges the official advisories from every ocean, such as the storm tracks layer on the GodsView hurricane tracker. Then, for any storm that matters to you, go to the official forecast centre for that ocean. There are several of them, they don't all use the same scales, and they don't always agree with each other. Knowing which one is in charge is most of the work.
This guide explains who forecasts which ocean, why the same storm can have two names and two strengths, and how to read forecasts from different agencies. If you want a walkthrough of a single storm on the map, cone and all, start with how to watch a hurricane live. This page is about the global picture.
Hurricane, typhoon or cyclone: one storm, three names
They are all tropical cyclones: rotating storms that form over warm tropical oceans. The name depends on where the storm is:
- Hurricane in the North Atlantic, the Caribbean and the eastern and central North Pacific.
- Typhoon in the western North Pacific.
- Cyclone (or tropical cyclone) in the Indian Ocean and the South Pacific.
A storm that crosses from one basin to another can change name. The physics does not change. What does change is the agency in charge, the naming list, and often the wind scale used to describe it.
Who forecasts each ocean: the RSMCs and warning centres
Through the World Meteorological Organization, each tropical ocean has an official forecast centre, called a Regional Specialized Meteorological Centre (RSMC), and in some areas national Tropical Cyclone Warning Centres (TCWCs) share the job. The US National Hurricane Center lists them as follows (NHC):
| Ocean area | Official centre | Run by | Local name for the storm |
|---|---|---|---|
| North Atlantic and eastern North Pacific | RSMC Miami | US National Hurricane Center (NHC) | Hurricane |
| Central North Pacific | RSMC Honolulu | US Central Pacific Hurricane Center (CPHC) | Hurricane |
| Western North Pacific and South China Sea | RSMC Tokyo | Japan Meteorological Agency (JMA) | Typhoon |
| North Indian Ocean (Bay of Bengal, Arabian Sea) | RSMC New Delhi | India Meteorological Department (IMD) | Cyclonic storm |
| Southwest Indian Ocean | RSMC La Réunion | Météo-France | Tropical cyclone |
| Southeast Indian Ocean and Australian region | TCWCs Perth, Darwin, Brisbane; Jakarta; Port Moresby | Bureau of Meteorology; Indonesia's BMKG; Papua New Guinea | Tropical cyclone |
| South Pacific | RSMC Nadi; TCWC Wellington | Fiji Meteorological Service; MetService New Zealand | Tropical cyclone |
The RSMC's forecast is the official one for its region. National weather services then issue warnings for their own coasts. In the US that is the National Weather Service; in the Philippines, PAGASA; in Australia, the Bureau of Meteorology.
Where JTWC fits in
You will often see a second set of numbers for storms in the Pacific and Indian Oceans. They come from the Joint Typhoon Warning Center (JTWC), a US Navy and Air Force command at Pearl Harbor. Its job is to provide "tropical cyclone reconnaissance, forecast, safety warning and decision support services" to US government agencies and US military forces in the Pacific and Indian Oceans (DVIDS). In late 2017 it moved from 12-hourly to 6-hourly warnings across its area.
JTWC is not an RSMC. It covers many of the same oceans as JMA, IMD, Météo-France and the Australian centres, but for US users. Its forecasts are public and in English, so some trackers republish them; GDACS, for example, carries JTWC forecasts for the western Pacific.
That is why you can see two different wind speeds for the same typhoon. JMA might say one thing and JTWC another. Usually both are right, because they measure wind differently (see below). For official warnings in a country, use that country's weather service or the RSMC, not JTWC.
Why storm names differ by basin
The names come from lists approved by WMO regional committees. Each region has its own rules (WMO).
Atlantic. Six lists are used in rotation, so the 2026 list returns in 2032. When a storm is so deadly or costly that reusing its name would be inappropriate, a WMO committee retires it. If a season runs past 21 named storms, NHC switches to a supplemental list kept by the WMO (NHC).
Eastern and central Pacific. The eastern North Pacific uses its own six-year lists. The central Pacific uses Hawaiian names from four lists, taken in order rather than by year.
Western North Pacific. Fourteen members of the Typhoon Committee, from Cambodia to Viet Nam, the USA and Hong Kong among them, contribute names to one list of 140. RSMC Tokyo uses them in order, without resetting each year: if the last storm of one year takes one name, the first storm of the next year takes the following name (WMO).
The Philippines. PAGASA gives storms a second, local name when a system becomes a tropical depression inside the Philippine Area of Responsibility, or enters it at that strength. The local names run alphabetically through the year and the list repeats every four years (GMA News). So one typhoon can have an international name and a Filipino name, and news reports in the Philippines often use both.
When you search for a storm, try both names, and check which agency named it. A storm may also be tracked as a numbered depression before it gets a name.
Why categories differ: Saffir-Simpson, JMA, IMD and Australia
This is where most confusion comes from. There is no global storm category.
Saffir-Simpson (Atlantic and eastern Pacific)
NHC and CPHC use the Saffir-Simpson Hurricane Wind Scale, Category 1 to 5, based on maximum sustained wind. Category 1 runs from 74 to 95 mph and Category 5 starts at 157 mph. NHC notes that it "does not take into account other potentially deadly hazards such as storm surge, rainfall flooding, and tornadoes" (NHC). US agencies average wind over one minute.
JMA (western North Pacific)
JMA reports maximum sustained wind as a ten-minute average (JMA). A tropical storm in its scheme has sustained wind of 34 knots or more and less than 48 knots. Above that come severe tropical storms and typhoons. For typhoons, JMA uses strength classes (JMA):
| JMA class | Ten-minute sustained wind |
|---|---|
| Strong | 64 to under 85 knots (33 to 44 m/s) |
| Very strong | 85 to under 105 knots (44 to 54 m/s) |
| Violent | 105 knots (54 m/s) and above |
Ten-minute averages come out lower than one-minute averages for the same storm. So a typhoon that JTWC rates at, say, 140 knots on a one-minute basis will usually have a lower number from JMA. Neither agency is exaggerating or playing it down.
India Meteorological Department (north Indian Ocean)
IMD uses its own words. During Cyclone Biparjoy in June 2023, IMD described a very severe cyclonic storm as one with sustained winds of 118 to 165 km/h and an extremely severe cyclonic storm as 166 to 220 km/h (The Business Standard, citing IMD). When you see these terms in Indian or Pakistani news, they are IMD stages, not Saffir-Simpson categories.
Météo-France La Réunion and Australia
In the southwest Indian Ocean, Météo-France uses French stage names such as cyclone and cyclone intense; forecasters at La Réunion use those words in their warnings to the island (L'info durable). In Australia, the Bureau of Meteorology uses its own five-category scale. These are separate systems: an Australian Category 3 is not the same as a US Category 3.
How to read forecasts from different agencies
Every agency forecasts the track of the storm's center and shows its uncertainty. They draw it differently.
- NHC's cone. Built from circles sized so that two-thirds of NHC's official track errors over the previous five years fall inside (NHC). It shows where the center may go, not how big the storm is.
- JMA's probability circles. JMA forecasts out to 120 hours (five days) and draws a circle at each forecast time into which the storm "is expected to move with a probability of 70%" (JMA).
- Other centres publish their own track maps and warning zones on their websites.
Two cones that look different are not necessarily disagreeing. They may be drawn from different probabilities. The hurricane watching guide shows how to read a cone step by step, including the forecast times written in UTC.
Advisory timing also differs. JMA issues information every three hours, with fuller forecasts at 00, 06, 12 and 18 UTC. JTWC works on a six-hour cycle. Always look at when a forecast was issued before you compare two maps.
Where to see all active storms at once
You have two choices: open every agency's site, or use a map that merges them.
| Option | What you get | Good for |
|---|---|---|
| GodsView hurricane tracker and the storm tracks layer on the globe | Every active tropical cyclone, with observed track, forecast track and cone where available, and the source agency in the storm panel | One map for every ocean, next to flights, ships and weather warnings |
| GodsView world events | A running list of active storms, quakes, fires and other events | A quick check of what is going on |
| GDACS | Alert levels for storms in every basin, based on people and infrastructure exposed | Humanitarian impact |
| Each RSMC and national weather service | Official forecasts and warnings | Decisions about your own area |
On GodsView, storms come from three public sources merged into one layer: NHC's current storms for the Atlantic and eastern and central Pacific, NASA EONET for open severe storm events worldwide, and GDACS for the alert level, countries at risk, forecast track, cone and wind field in every basin. The storm panel names the agency that wrote the forecast you are looking at. The methodology page lists every source.
To open it, go to the hurricane tracker and pan to any ocean, or open the globe, open Layers, and switch on Storm tracks. Add Satellite clouds to see the storm itself. Weather warnings lists the official warnings in force for cities around the world, which is often the faster way to see whether a storm is already affecting land.
Getting an alert for the next storm
Watching a map works for a storm you already know about. For the next one, set an alert.
On GodsView, add a place on My places, or draw a watch area on the map, and keep the tropical cyclone rule on. GodsView checks for storms along with earthquakes, severe weather warnings, floods and wildfires, and sends alerts in the app, by browser push and by email. Alerts need a paid plan. The alerts tutorial shows each step, and the disaster alerts guide compares GodsView with official alert systems.
For warnings you must act on, rely on your national weather service and local emergency managers. A worldwide map helps you see a storm coming. It does not replace the people responsible for your coast.
A short checklist for following any storm
- Find the right agency. Use the table above to see which RSMC covers the storm's ocean.
- Check the name and number. Search both the international and any local name.
- Check the wind average. One-minute or ten-minute? Do not compare categories across scales.
- Check the advisory time. Convert UTC to your own time.
- Read the cone or circle as uncertainty about the center, not as the size of the storm.
- Follow local warnings for any decision about leaving or staying.
Storms often trigger other hazards. If you follow them, the earthquake website guide and the wildfire map guides cover the other big live hazards in the same way.
Frequently asked questions
Is there a tracker that shows every hurricane and typhoon in the world?
Yes. The storm tracks layer on the GodsView hurricane tracker and globe shows every active tropical cyclone, merging NHC, NASA EONET and GDACS data. For official forecasts, use the regional centre for each ocean.
What is the difference between a hurricane, a typhoon and a cyclone?
Nothing physical. They are all tropical cyclones. They are called hurricanes in the Atlantic and eastern and central North Pacific, typhoons in the western North Pacific, and cyclones in the Indian Ocean and South Pacific.
Why do JTWC and JMA give different wind speeds?
JTWC, a US military centre, uses one-minute sustained winds. JMA, the official regional centre for the western North Pacific, uses ten-minute averages, which come out lower for the same storm. Their analyses can also differ.
Who names typhoons?
RSMC Tokyo assigns names in order from a list of 140 names contributed by 14 Typhoon Committee members. In the Philippines, PAGASA also gives a local name to storms in its area of responsibility, so one typhoon can have two names.
Is an Australian Category 3 cyclone the same as a Category 3 hurricane?
No. Australia's Bureau of Meteorology uses its own five-category scale, which is separate from the Saffir-Simpson scale used for Atlantic hurricanes. Compare wind speeds, and check the averaging period, instead of category numbers.
What does a very severe cyclonic storm mean?
It is an India Meteorological Department stage for the north Indian Ocean. During Cyclone Biparjoy in 2023, IMD described it as sustained winds of 118 to 165 km/h, with extremely severe cyclonic storm at 166 to 220 km/h.
Sources
- NHC: Worldwide tropical cyclone centers (RSMCs and TCWCs)
- NHC: Tropical cyclone names
- NHC: Saffir-Simpson Hurricane Wind Scale
- NHC: Definition of the track forecast cone
- WMO: Tropical cyclone naming
- WMO: Western North Pacific and South China Sea names
- JMA RSMC Tokyo: Tropical cyclone advisories
- JMA: Typhoon strength and size classes (Japanese)
- DVIDS: Joint Typhoon Warning Center increases warnings (2017)
- GMA News: How PAGASA names tropical cyclones
Facts checked on against each provider's own site.